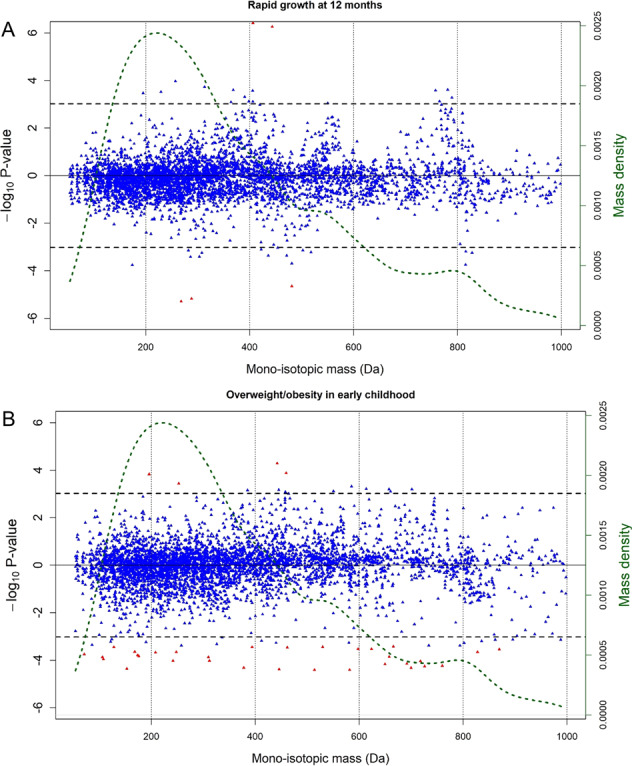
Fig. 1. Metabolome wide associations with rapid growth and overweight.

Signed Manhattan-type plot presenting the analysis of the 4714 UPLC-MS metabolic features for Model 1 for A rapid growth at twelve months of age and for B overweight in early childhood. The red dots represent the features that remain significant after applying the FDR threshold of 5%, whereas blue dots do not. The vertical axis shows the signed −log10 P value. The horizontal axis represents the monoisotopic mass (in Da). UPLC-MS-associated metabolic features are available in Table S3 and Table S6. The dotted green line represents the mass density.
