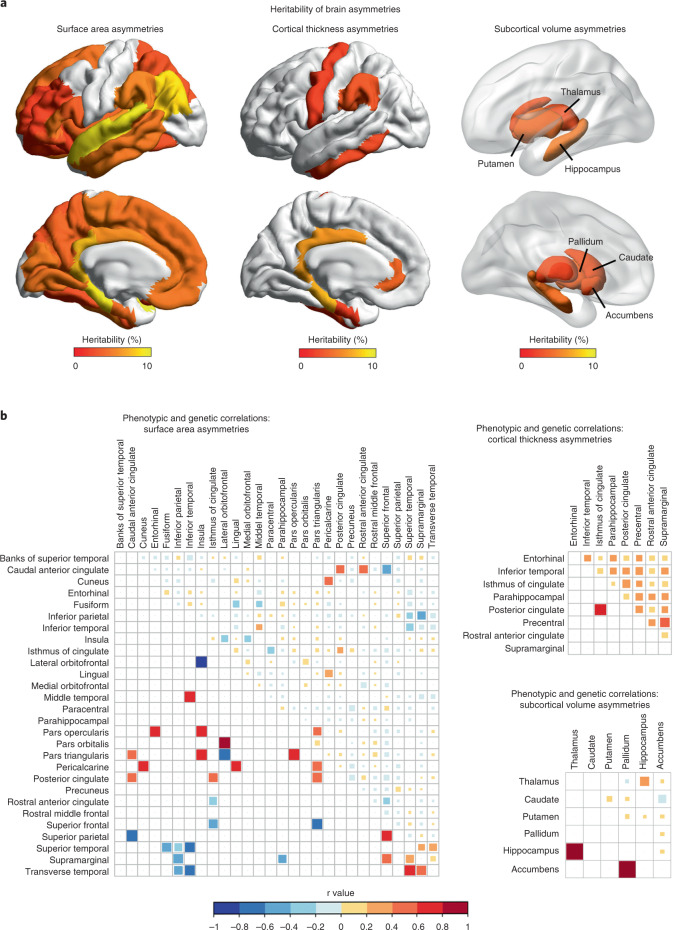
Fig. 1. SNP-based heritability and correlation analysis of regional brain asymmetry measures.
a, SNP-based heritability estimates for brain asymmetry measures. Only regions for which AIs were significantly heritable are indicated in colour. b, Genetic and phenotypic correlations between AIs. Phenotypic (upper right triangle) and genetic (lower left triangle) correlations between each pair of AIs. Only significantly heritable AIs that also have at least one significant phenotypic or genetic correlation after FDR correction are shown. The colours of the squares indicate the correlation coefficients according to the colour key, and their areas are proportional to the correlation coefficients.

