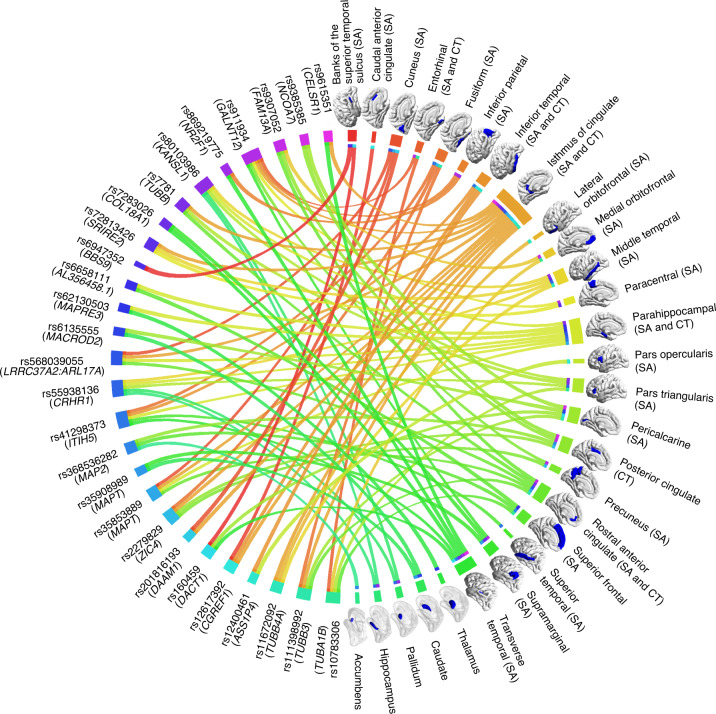
Fig. 3. Overview of 27 independent lead variants associated with different regional brain asymmetries.
Circle plot illustrating the 27 lead variants from mvGWAS (left) in relation to the central asymmetry indexes (right) underlying their specific multivariate associations. Different colours indicate different lead variants or regional asymmetries. Lines linking lead variants to regional asymmetries are coloured according to the regions. The closest genes to the lead variants are shown. Most central asymmetry indexes are of regional surface areas, and some variants affected multiple asymmetries of different types. SA, surface area; CT, cortical thickness; SUB, subcortical volume.

