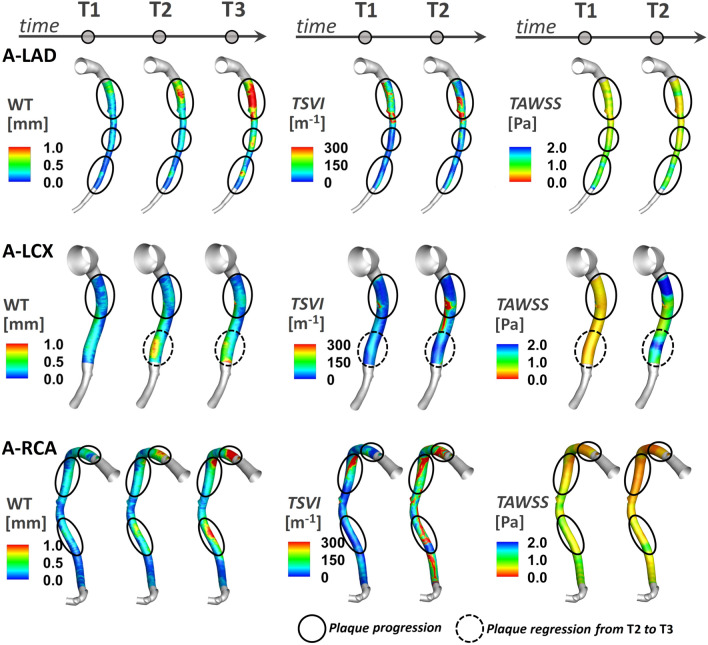
Figure 4.
Luminal distributions of measured WT, TSVI, and TAWSS at several time points along the follow-up time for the coronary artery models of pig A. The distributions of WT, TSVI, and TAWSS are only shown along the IVUS segment of the main vessel. The side branches are not shown. The regions of interest identified along each vessel are emphasized by solid black circle if experiencing plaque progression over time or dashed black circle if experiencing plaque regression between T2 and T3.

