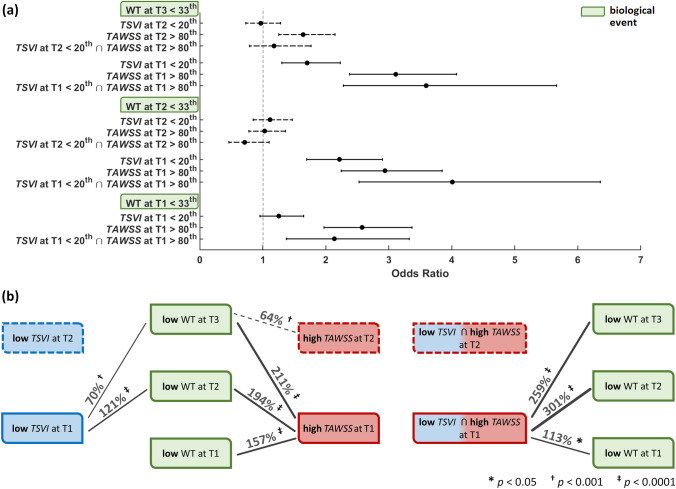
Figure 6.
Predictive ability of hemodynamic descriptors for low WT. (a): odds ratios with associated confidence interval for hemodynamic events vs. low WT at the various time points (b): graphical sketch of the identified significant associations between hemodynamic and biological events. The favourable (low WT) biological events are indicated in green. Blue and red now indicate (ostensibly physiologically-normal) low TSVI and high TAWSS, respectively. Associations are represented by black lines whose thickness is proportional to the indicated percent increase in odds of high WT (p-values also shown). Solid vs. dashed lines indicate associations for hemodynamic events at T1 vs. T2, respectively.

