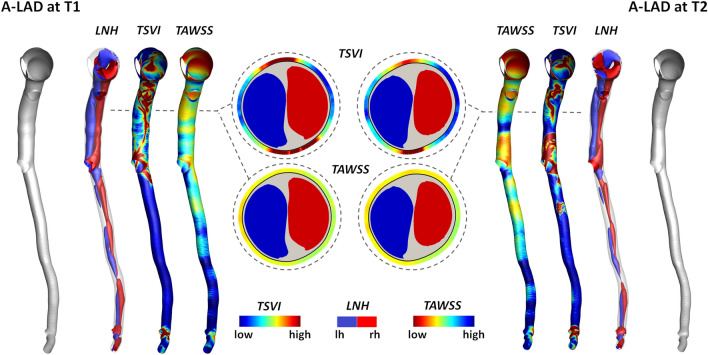
Figure 7.
Distribution of intravascular helical blood flow features and TSVI and TAWSS at the luminal surface of the LAD of pig A at T1 (left) and T2 (right) of the study. Right-handed (LNH > 0) and left-handed (LNH < 0) helical blood structures are displayed by red and blue, respectively. The luminal distributions of TSVI and TAWSS are also shown. Only the main vessel is displayed; the side branches are not depicted. One explanatory luminal cross-section per model is reported. The lumen contour is markedly thick for a better visualization of TSVI and TAWSS values at the luminal cross-section edge.

