Fig. 4.
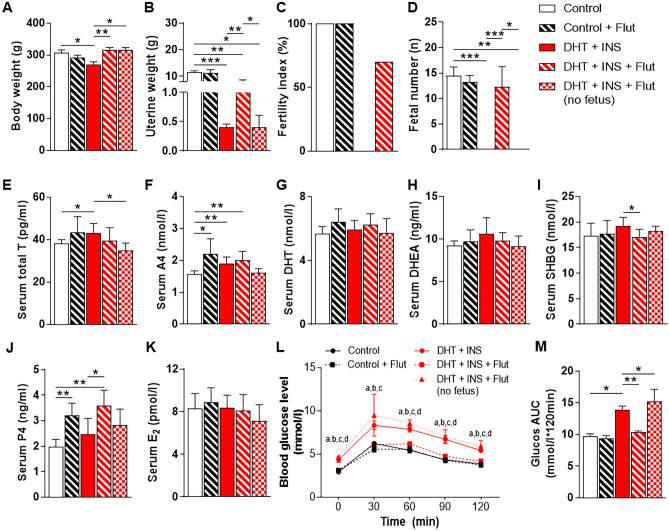
Chronic treatment with flutamide induces changes in hormones and metabolites in control and DHT + INS-exposed pregnant rats at GD 14.5. Comparison of body weight A, uterine weight B, fertility index C, fetal number D, serum total T E, A4 F, DHT G, DHEA H, SHBG I, P4 J, E2 K, blood glucose concentrations during OGTT L, and area under the curve (AUC) for glucose M in pregnant rats treated with and without DHT and INS [n = 10/group, except for the DHT + INS + flutamide group (with fetuses, n = 7) and the DHT + INS + flutamide (without fetuses) group (n = 3)]. The fertility index is the percentage of matings that resulted in pregnancy. AUC was calculated by the formula [0.5 × (BG0 + BG30)/2 + 0.5 × (BG30 + BG60)/2 + 0.5 × (BG60 + BG90)/2 + 0.5 × (BG90 + BG120)/2], where the BG terms are the blood glucose levels at 0 min, 30 min, 60 min, 90 min, and 120 min. aP < 0.05, control (vehicle) group vs. DHT + INS group; bP < 0.05, control group vs. DHT + INS + flutamide (no fetuses) group; cP < 0.05, DHT + INS group vs. DHT + INS + flutamide (with fetuses) group; dP < 0.05, DHT + INS + flutamide group vs. DHT + INS + flutamide (without fetuses) group. In all plots, data are presented as means ± SEM. Statistical tests are described in the “Materials and methods” section, and differences between the groups are reported as *P < 0.05, **P < 0.01, and ***P < 0.001

