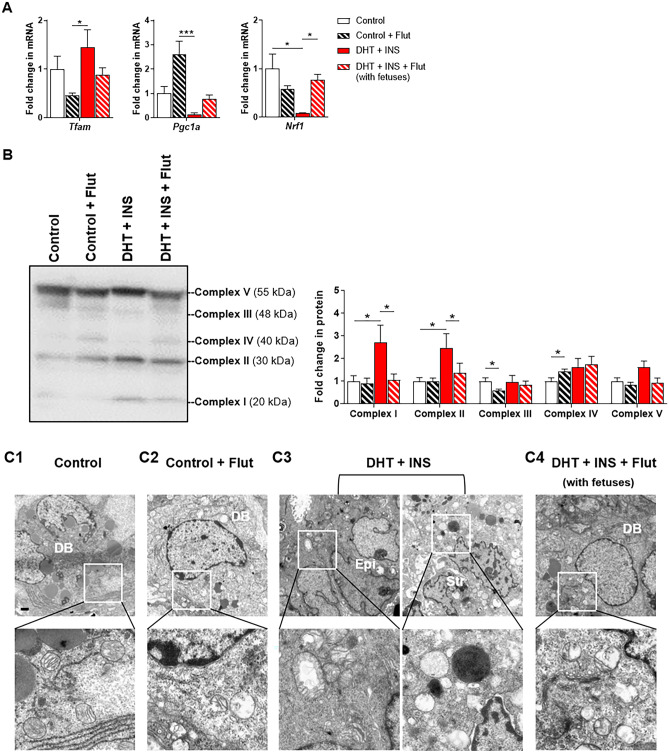
Fig. 6.
Effects of flutamide on mitochondrial transcriptional activation, uterine oxidative phosphorylation (OXPHOS) protein expression, and mitochondrial morphology in control and DHT + INS-exposed pregnant rats at GD 14.5. After removing the embryos/fetuses and placentas, uterine tissues from control and DHT + INS-exposed pregnant rats treated with flutamide were used for analyzing mRNA levels of Tfam, Pgc1a, and Nrf1 by qPCR (A, n = 5–7/group), and the relative protein abundance of O2-dependent mitochondrial OXPHOS subunits was determined by Western blotting (B, Complexes I–V, 5–6/group). The size representation in kDa, as determined by a molecular weight ladder, is shown to the right. In all plots, data are presented as means ± SEM (vs. Control vehicle values). Statistical tests are described in the “Materials and methods” section, and differences between the groups are reported as * P < 0.05, ** P < 0.01, and *** P < 0.001. Uterine ultrastructural analysis by TEM in control (C1–C2) and DHT + INS-treated (C3–C4) pregnant rats treated with flutamide (C2 and C4). Images are representative of two tissues per group, and enhanced magnifications are shown in the lower panel of each photomicrograph. DB, decidual basalis; Epi, epithelial cells; Str, stromal cells. Scale bars (2 μm) are indicated in the photomicrographs

