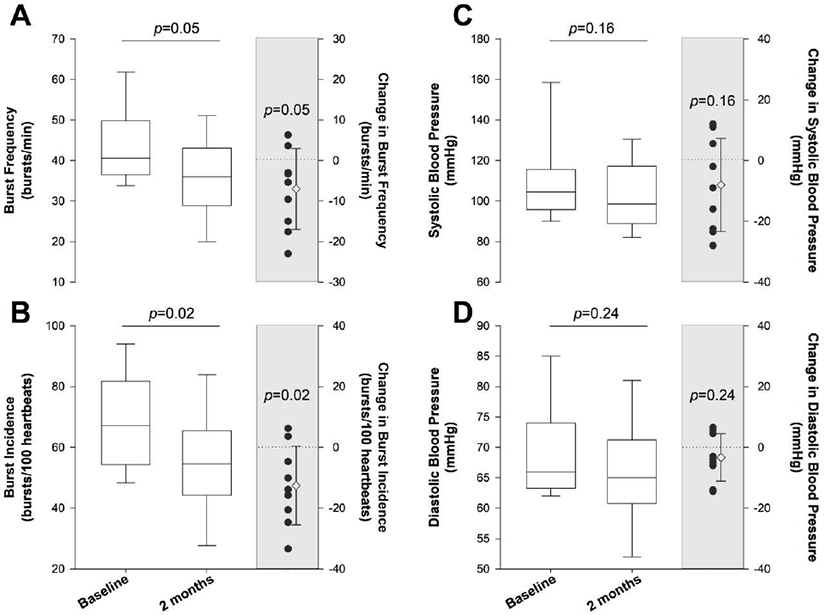
Figure 2.

Muscle sympathetic nerve activity (MSNA) burst frequency (Panel A) and burst incidence (Panel B), as well as systolic blood pressure (Panel C) and diastolic blood pressure (Panel D) at baseline and after 2 months of treatment with sacubitril-valsartan in male patients with heart failure with reduced ejection fraction (n = 9). For all panels, the left and right boxplots represent baseline and after two months of treatment with sacubitril-valsartan. The solid line in the box plot represents the median, whereas the upper and lower limits of the box plot represent the 75th percentile and 25th percentile, respectively. The whiskers represent the range of data (minimum and maximum). The scatterplot (shaded region) represents the individual change values as well as the group mean and standard deviation.
