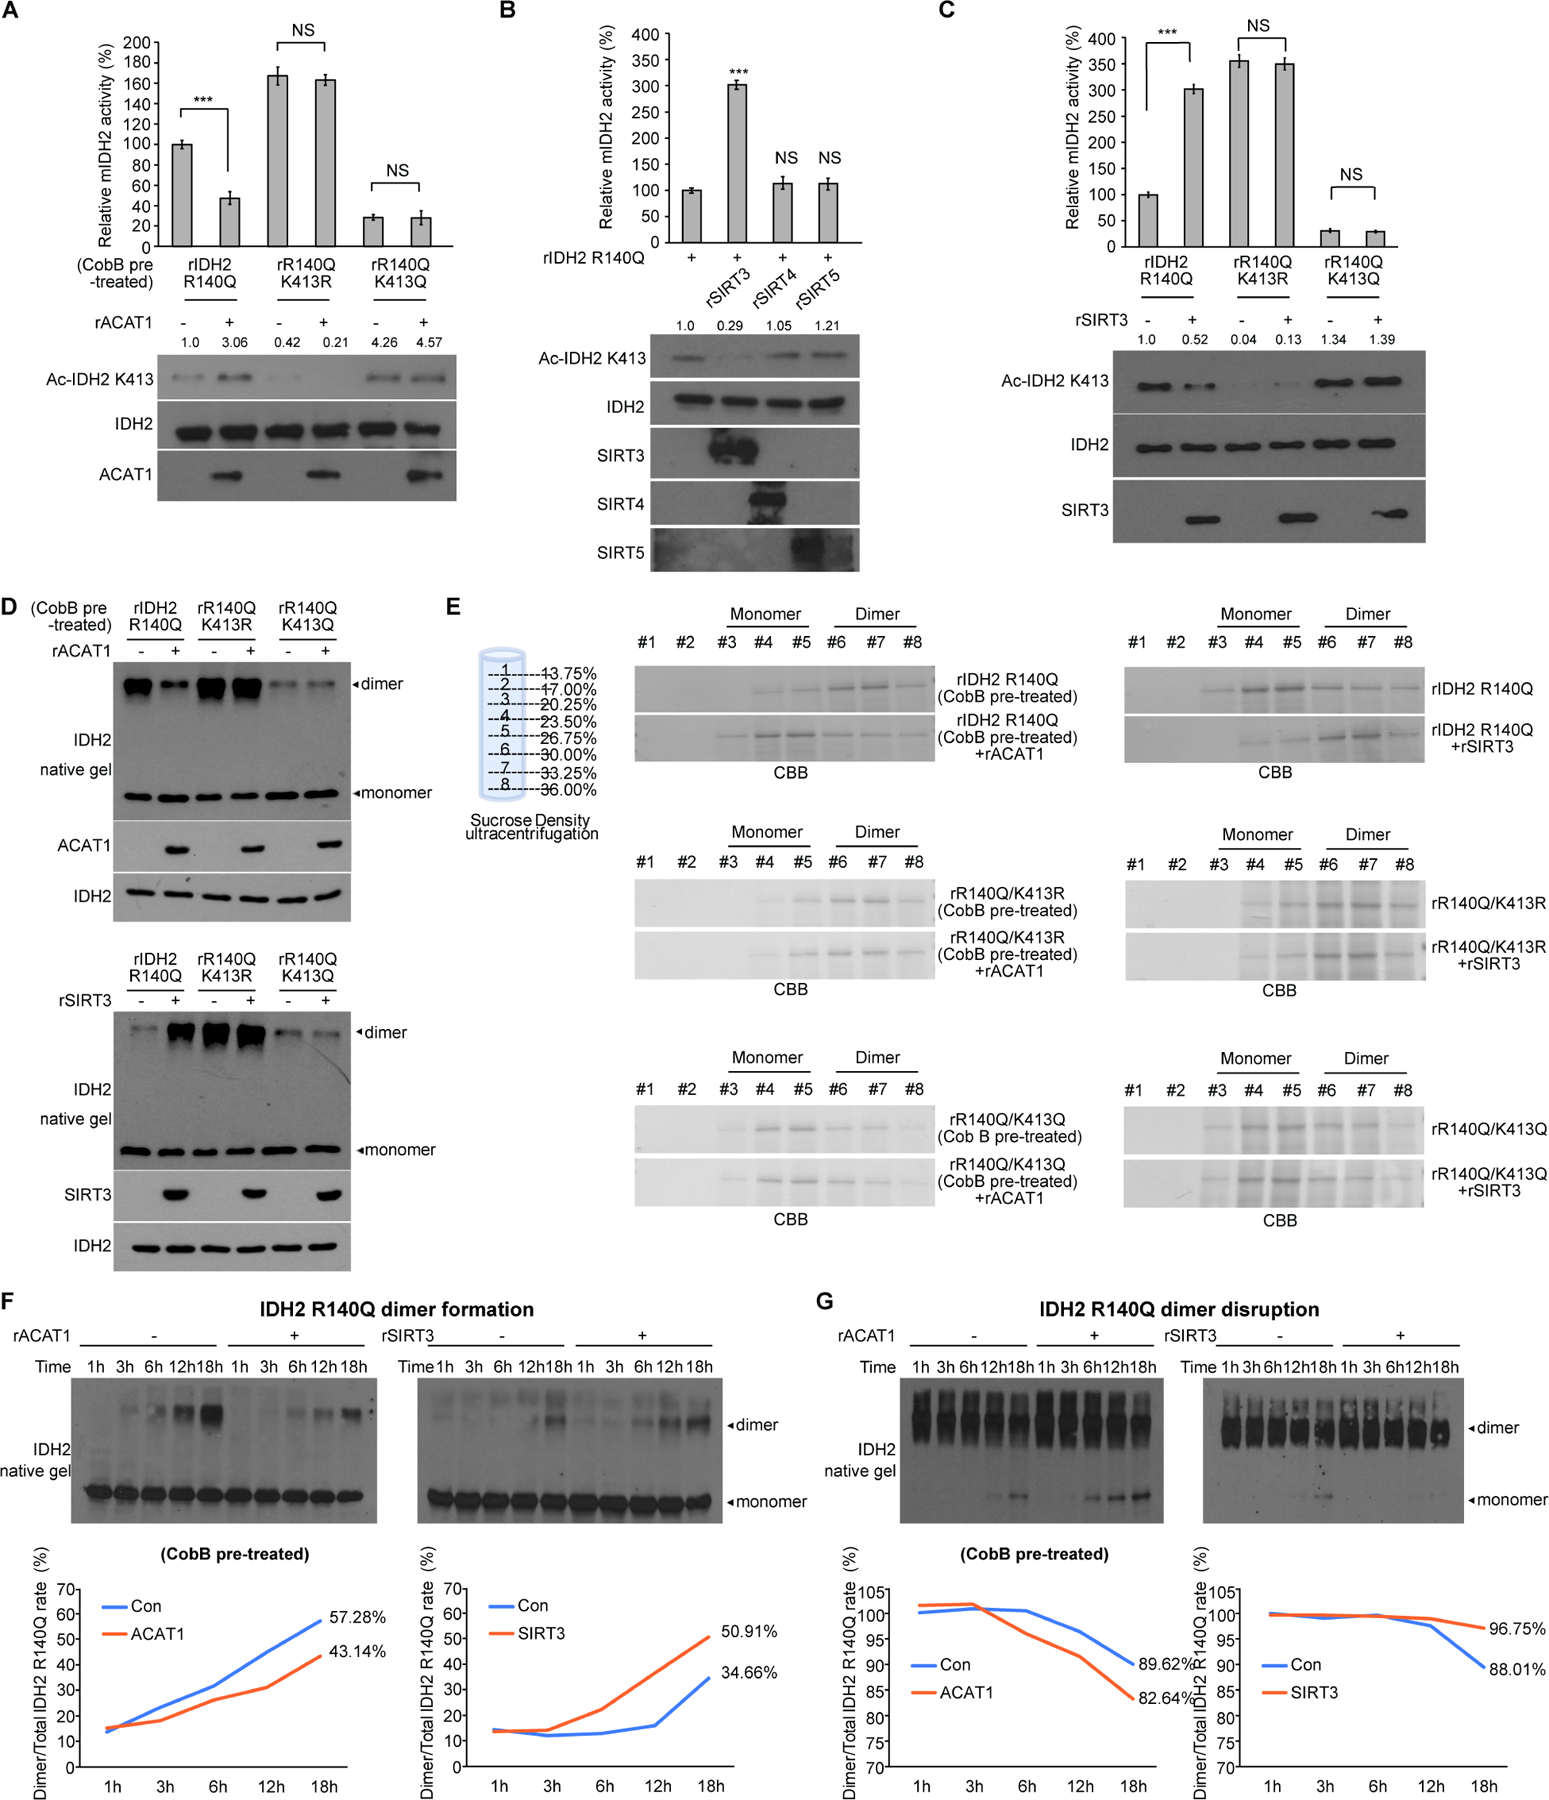
Figure 2. Mitochondrial ACAT1 and SIRT3 as upstream acetyltransferase and deacetylase, respectively, regulate K413-acetylation of mIDH2, which inhibits mIDH2 by attenuating dimer formation from monomers and destabilizing dimers for conversion to monomers.

(A) Purified IDH2 R140Q variants were incubated with upstream acetyltransferase rACAT1, followed by mIDH2 catalytic activity assay (upper) and Western blot to detect K413-acetylation (lower).
(B) Purified IDH2 R140Q protein was incubated with purified recombinant deacetylases including rSIRT3, rSIRT4 or rSIRT5, followed by mIDH2 catalytic activity assay (upper) and Western blot to detect K413-acetylation (lower).
(C) Purified IDH2 R140Q variants were incubated with upstream deacetylase SIRT3, followed by mIDH2 catalytic activity assay (upper) and Western blot to detect K413-acetylation (lower).
(D) Purified IDH2 R140Q variants were either pre-treated with cobB protein deacetylase followed by incubation with acetyltransferase rACAT1 (upper) or treated with deacetylase rSIRT3 (lower), prior to being applied to native gel. Dimeric and monomeric mIDH2 proteins were determined by Western blot.
(E) Left panels: rIDH2 R140Q (top), rIDH2 R140Q/K413R (middle) and rIDH2 R140Q/K413Q (bottom) proteins were pre-treated with cobB followed by incubation with rACAT1 prior to sucrose density ultracentrifugation. Right panels: rIDH2 R140Q (top), rIDH2 R140Q/K413R (middle) and rIDH2 R140Q/K413Q (bottom) proteins were incubated with rSIRT3 prior to sucrose density ultracentrifugation. Collected fractions were applied to PAGE, followed by CBB staining.
(F) Purified monomeric IDH2 R140Q protein was either pre-treated with cobB followed by incubation with rACAT1 (left) or treated with rSIRT3 (right) in a time dependent manner, followed by native PAGE. Spontaneous dimer formation was determined by Western blotting. Lower panels show density analysis of corresponding bands to assess dimer formation in Western blotting. The ratio between homodimers and total mIDH2 proteins was quantitatively determined based on density analyses of the Western blotting.
(G) Purified dimeric IDH2 R140Q protein was either pre-treated with cobB followed by incubation with rACAT1 (left) or treated with rSIRT3 (right) in a time dependent manner, followed by native PAGE. Spontaneous monomer conversion was detected by Western blotting. Lower panels show density analysis of corresponding bands to assess dimer formation in Western blotting. The ratio between homodimers and total mIDH2 proteins was quantitatively determined based on density analyses of the Western blotting.
The error bars represent mean values ±SD from three replicates of each sample (***: p<0.001; ns: not significant); Data are mean ±SD; p values were obtained by a two-tailed Student’s t-test.
