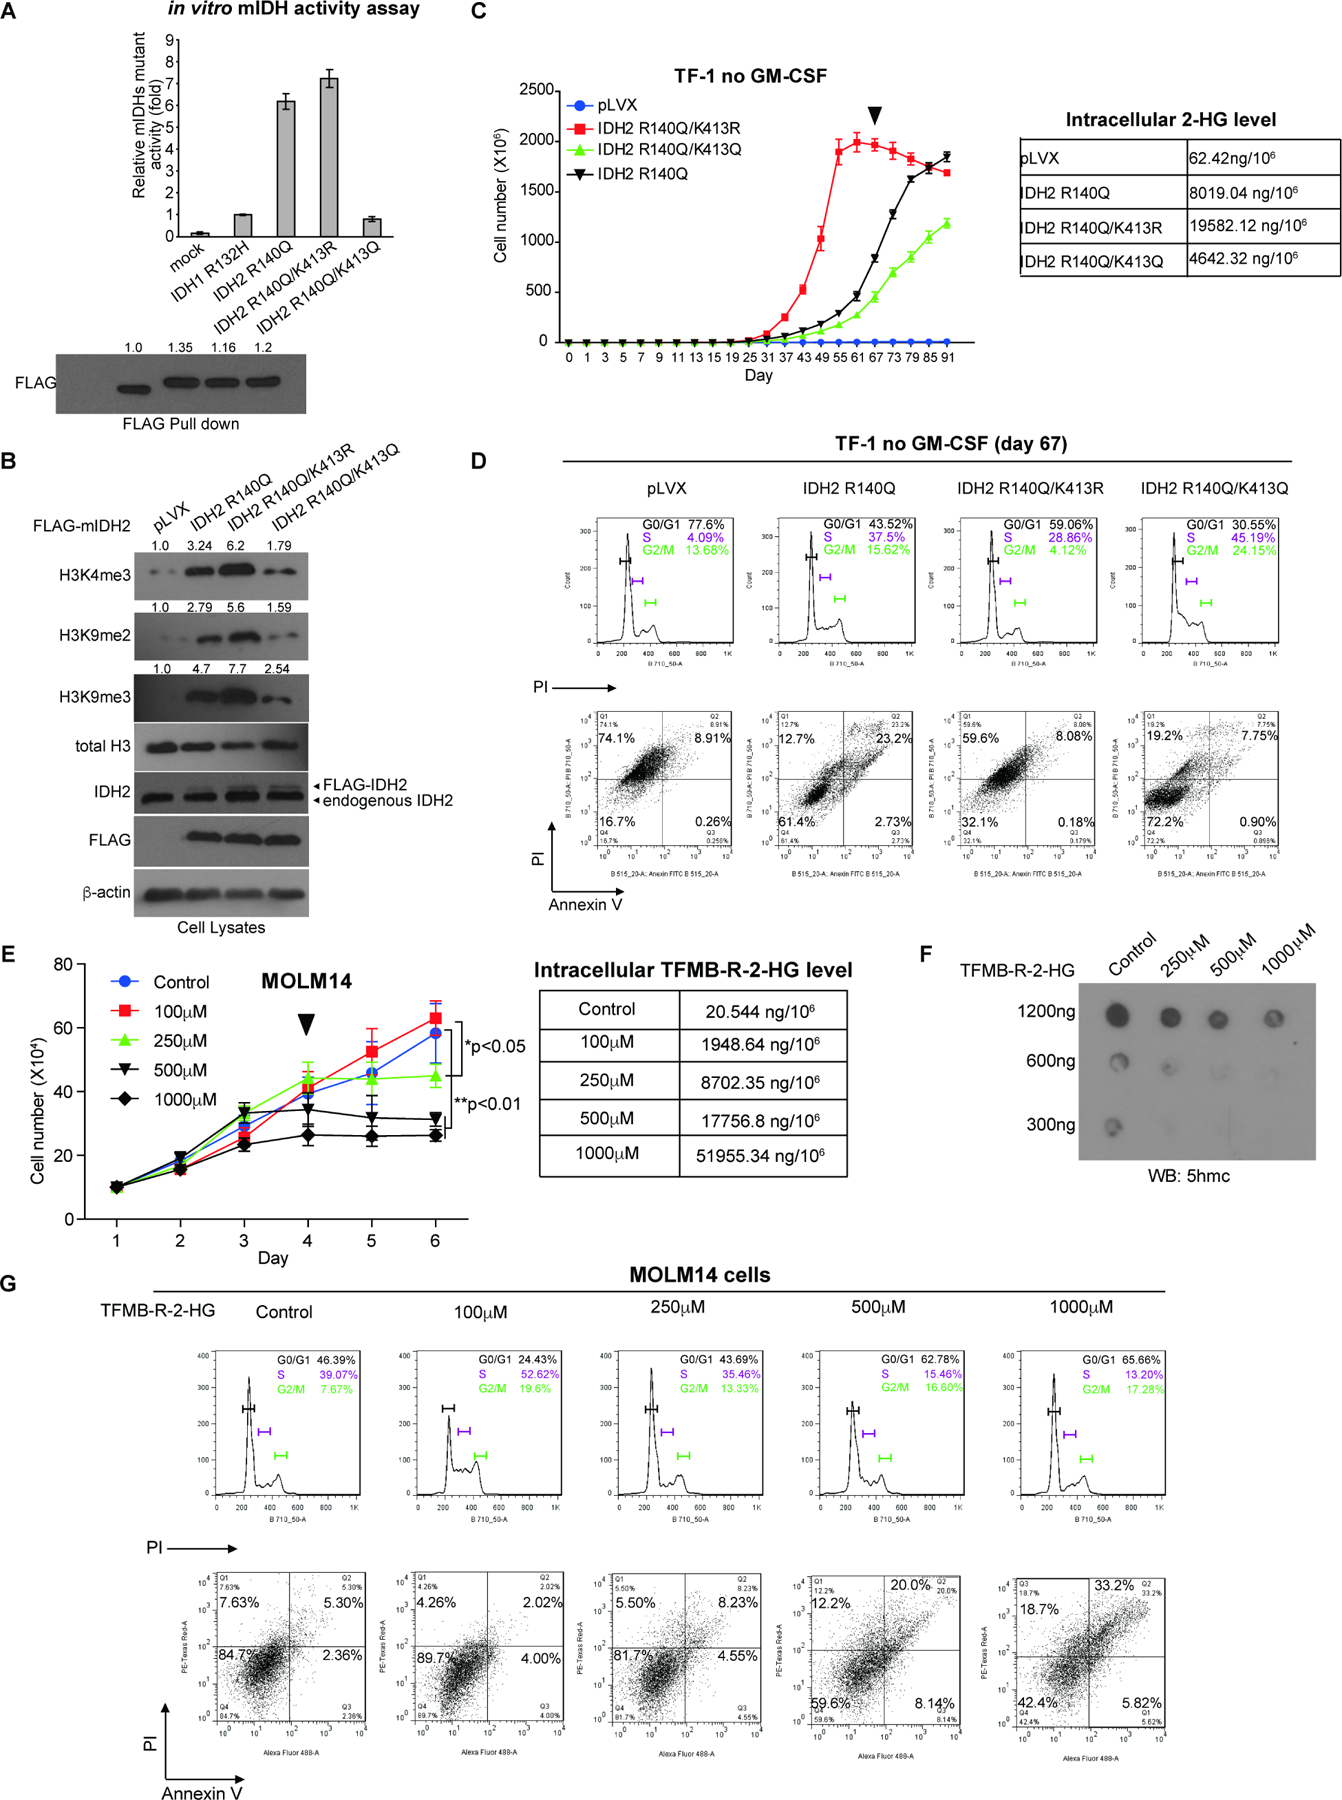
Figure 5. Restricted activity of mIDH2 by K413-acetylation is comparable to mIDH1, which is sufficient to produce enough 2-HG for transformation and avoids cytotoxicity of high levels of 2-HG.

(A) FLAG-tagged IDH1 R132H mutant and IDH2 R140Q variants with acetyl-deficient K413R or acetyl-mimetic K413Q mutations were overexpressed in 293T cells. FLAG-pull down samples were applied to mutant IDH catalytic activity assay (upper) and Western blot for protein input levels (lower).
(B) TF-1 cell lines stably expressing FLAG-tagged mIDH2 variants were generated, followed by Western blot to detect histone methylation.
(C) Left: Proliferation rates of TF-1 cells stably expressing mIDH2 variants in the absence of GM-SCF. Cells were harvested at day 67 (indicated by a triangle) and cell lysates were applied to NMR for measurement of intracellular 2-HG levels (right).
(D) TF-1 cells stably expressing different mIDH2 variants were harvested at day 67 and applied to cell cycle analysis (upper panels) and cell death/apoptosis assay with PI and annexin V staining (lower panels).
(E) Left: Effects of cell-permeable TFMB-R-2-HG on MOLM14 cells. Right: MOLM14 cells treated with increasing concentrations of TFMB-R-2-HG were harvested at day 4 (indicated by a triangle) and intracellular 2-HG concentrations were measured by NMR.
(F) Effects of TFMB-R-2-HG treatments on DNA methylation in MOLM14 cells were assessed by dot blot to detect 5-hydroxymethylcytosine (5hmC). Input amounts of total genomic DNA are shown.
(G) MOLM14 cells treated with increasing concentrations of TFMB-R-2-HG were harvested at day 4 and applied to cell cycle analysis (upper panels) and cell death/apoptosis assay with PI and annexin V staining (lower panels).
The error bars represent mean values ±SD from three replicates of each sample (*: 0.01<p<0.05; **: 0.01<p<0.001); Data are mean ±SD; p values were obtained by a two-tailed Student’s t-test.
