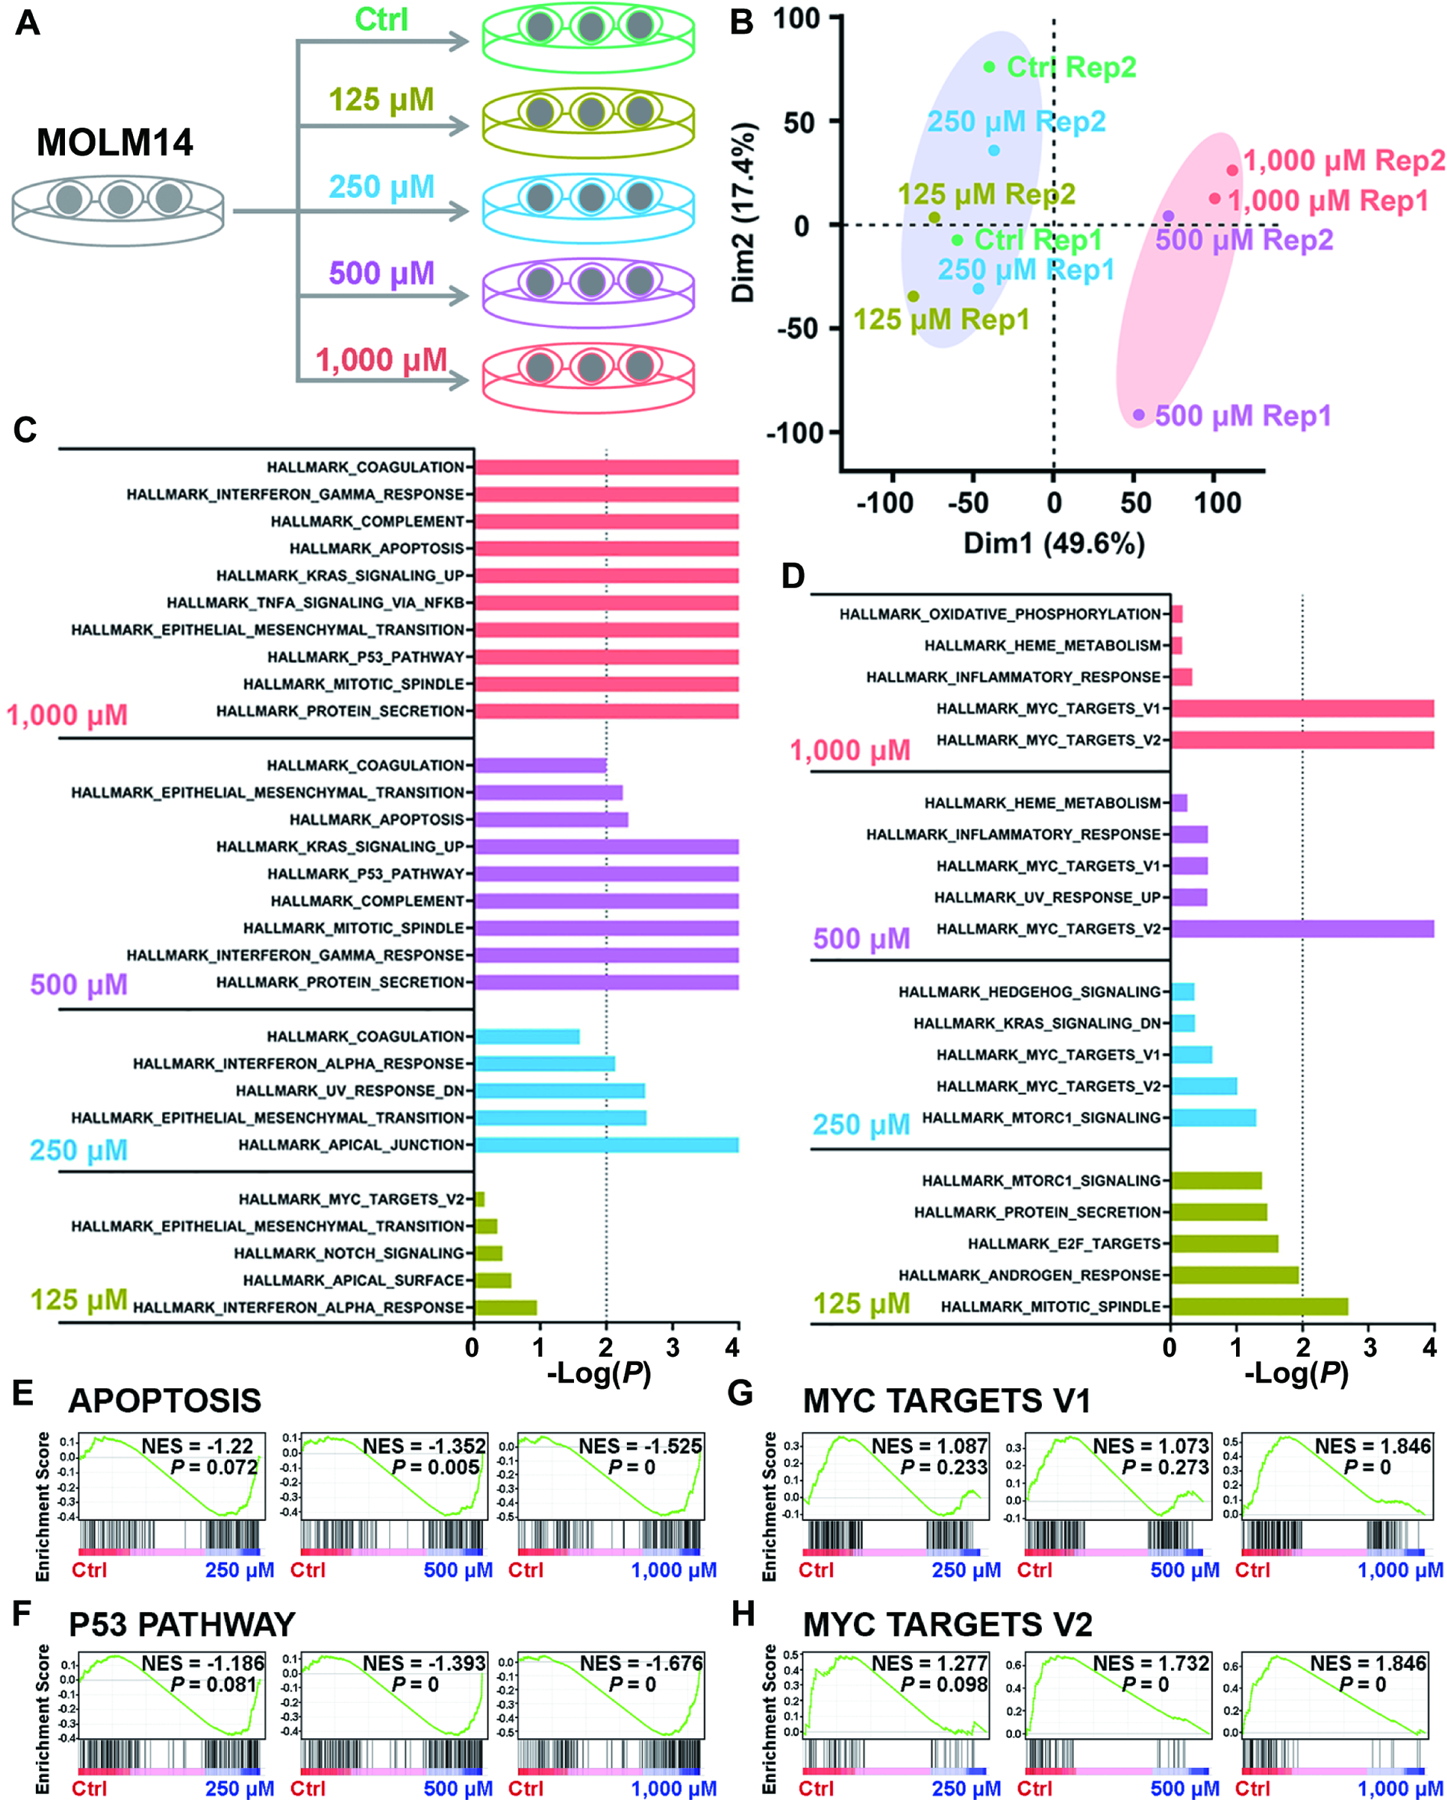
Figure 6. Identification of the signal pathways responsible for cytotoxicity induced by high levels of intracellular 2-HG via transcriptome-wide RNA-seq.

(A) Schematic diagram of RNA-seq with Molm14 cells upon treatment with 125, 250, 500, and 1,000 μM TFMB-R-2-HG.
(B) Principal component analysis (PCA) of RNA-seq data from Molm14 cells treated with TFMB-2-HG.
(C and D) The core-enriched signal pathways, including the upregulated (C) and downregulated (D) ones based on Gene Set Enrichment Analysis (GSEA), in TFMB-2HG-treated cells in contrast to vehicle control (Ctrl).
(E and F) GSEA of upregulated apoptosis (E) and P53 pathway (F) induced by TFMB-2-HG treatment in Molm14 cells. NES, Normalized Enrichment Score.
(G and H) GSEA of downregulated MYC target V1 (G) and MYC target V2 (H) induced by TFMB-2-HG treatment in Molm14 cells.
All RNA-seq experiments were conducted with 2 independent biological replicates.
