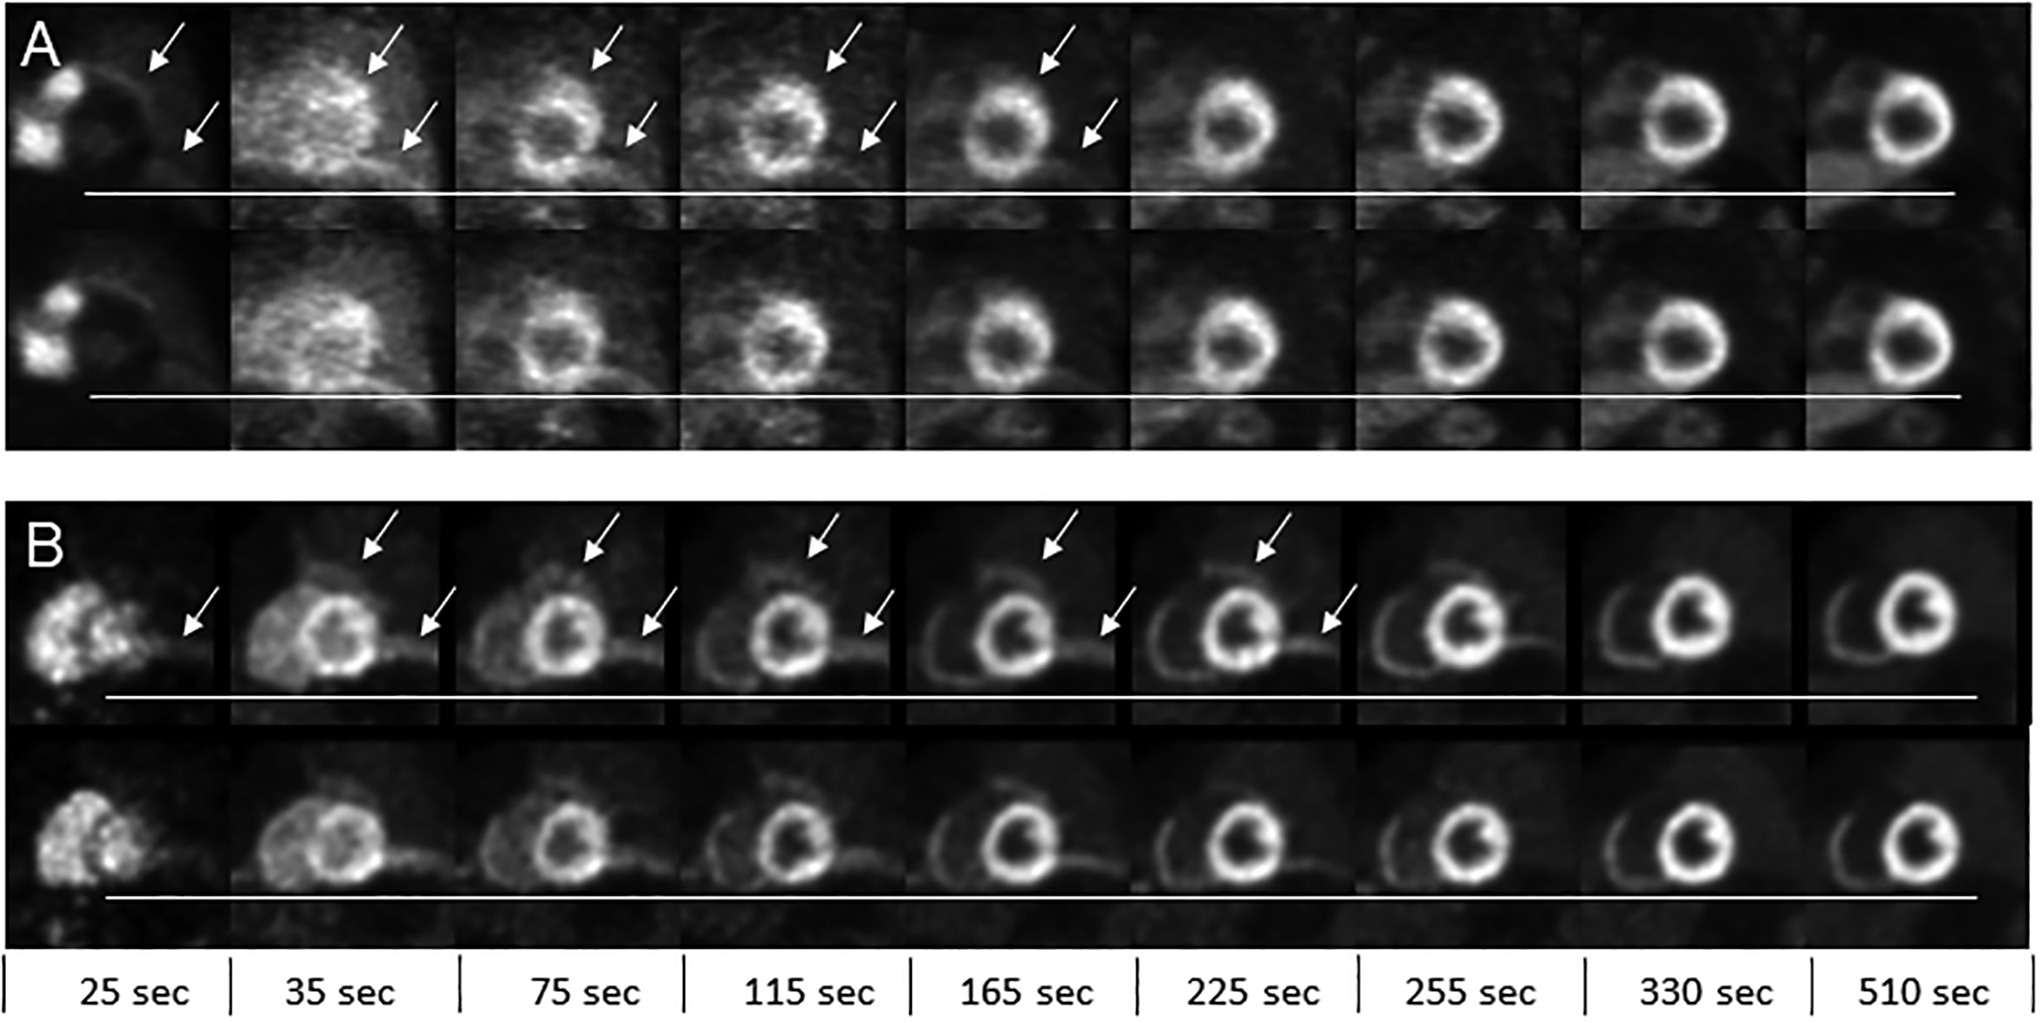
Figure 3.

Reformatted short axis slices at select frame times (e.g. mid-point times) shown for (A) a patient study and (B) 10 mm cardiac creep simulation. The top row in each panel are the uncorrected images and bottom row are motion corrected images. The horizontal line served as a visual reference to assess the change in heart position over the selected frames. The arrows show areas of artificially high activity concentration due to mismatch between the PET and CT during attenuation correction. These errors are present on both the uncorrected and motion corrected image but indicated in the top row only for each panel.
