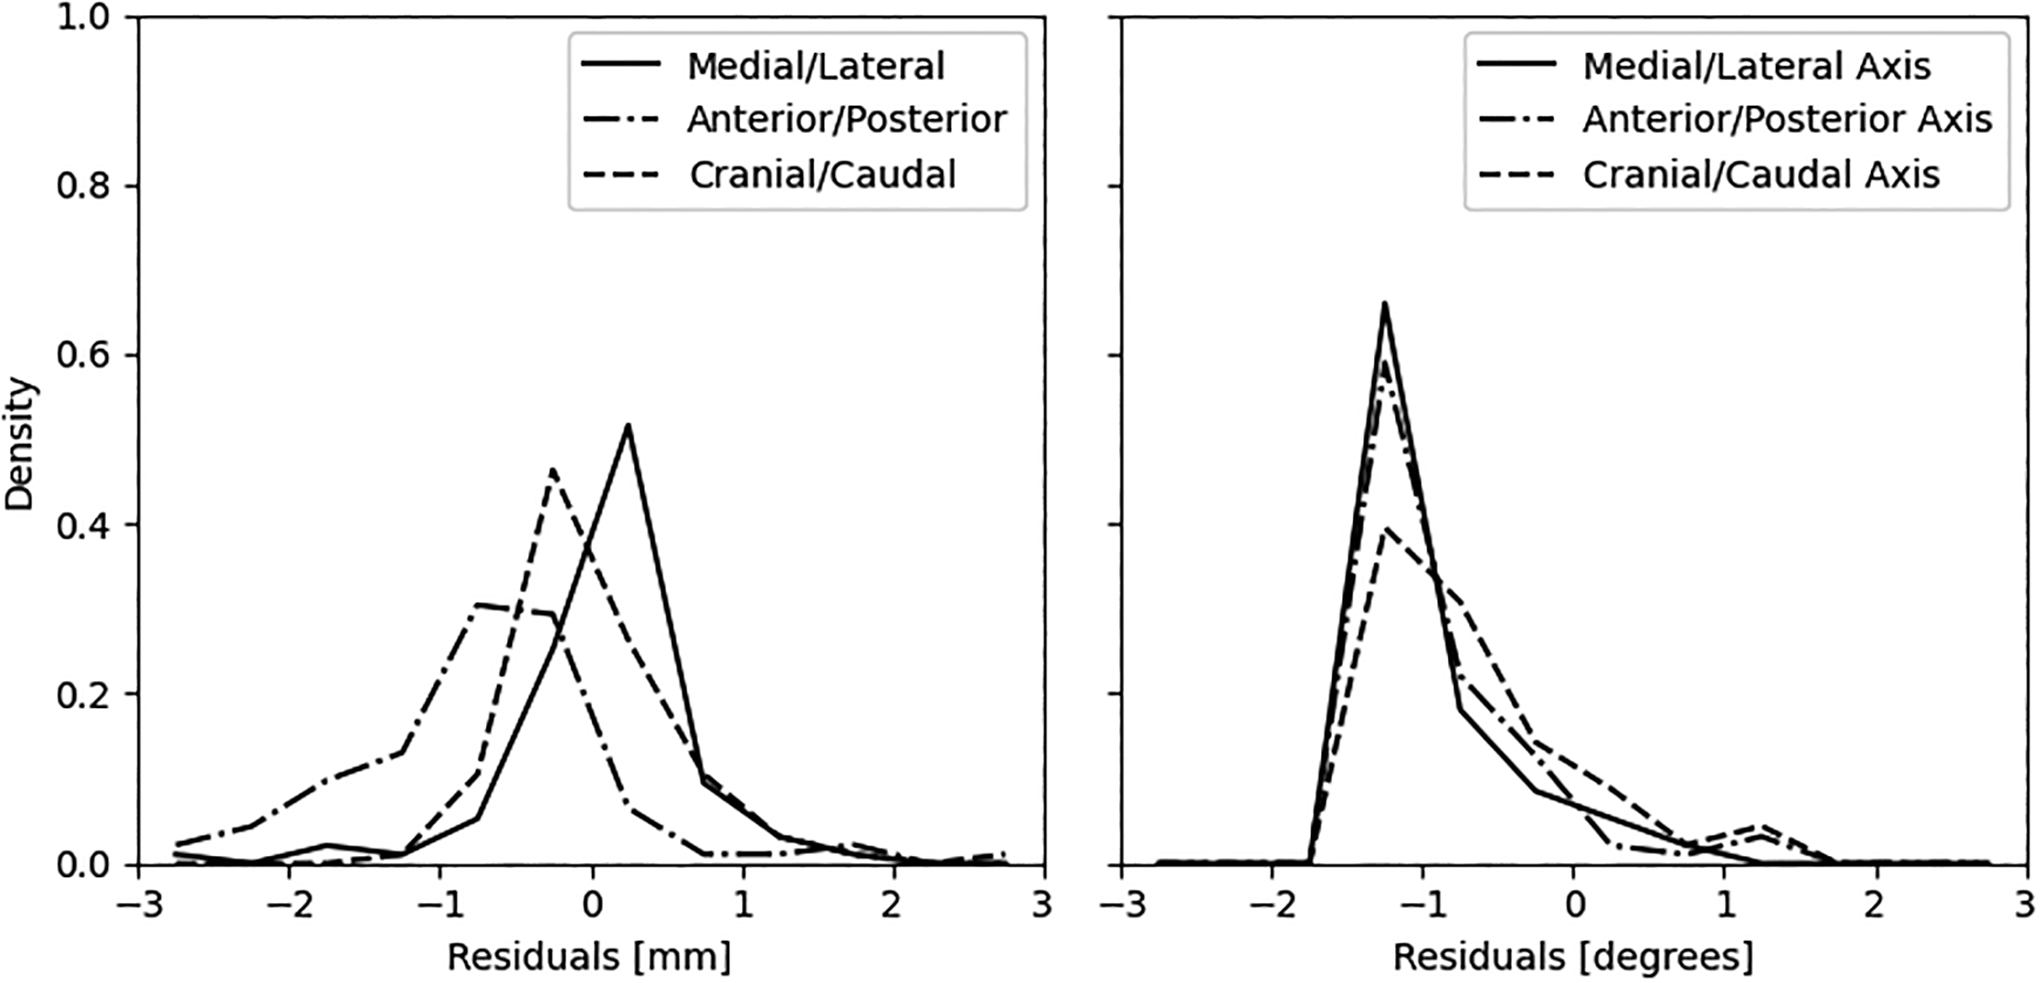
Figure 5.

Density plots of the (A) residual center of mass distances and (B) residual rotations about the center of mass, between the rest “ground truth” and motion corrected stress masks of the XCAT simulations. Bins are 0.5 mm and 0.5 degrees centered on the x-axis, respectively.
