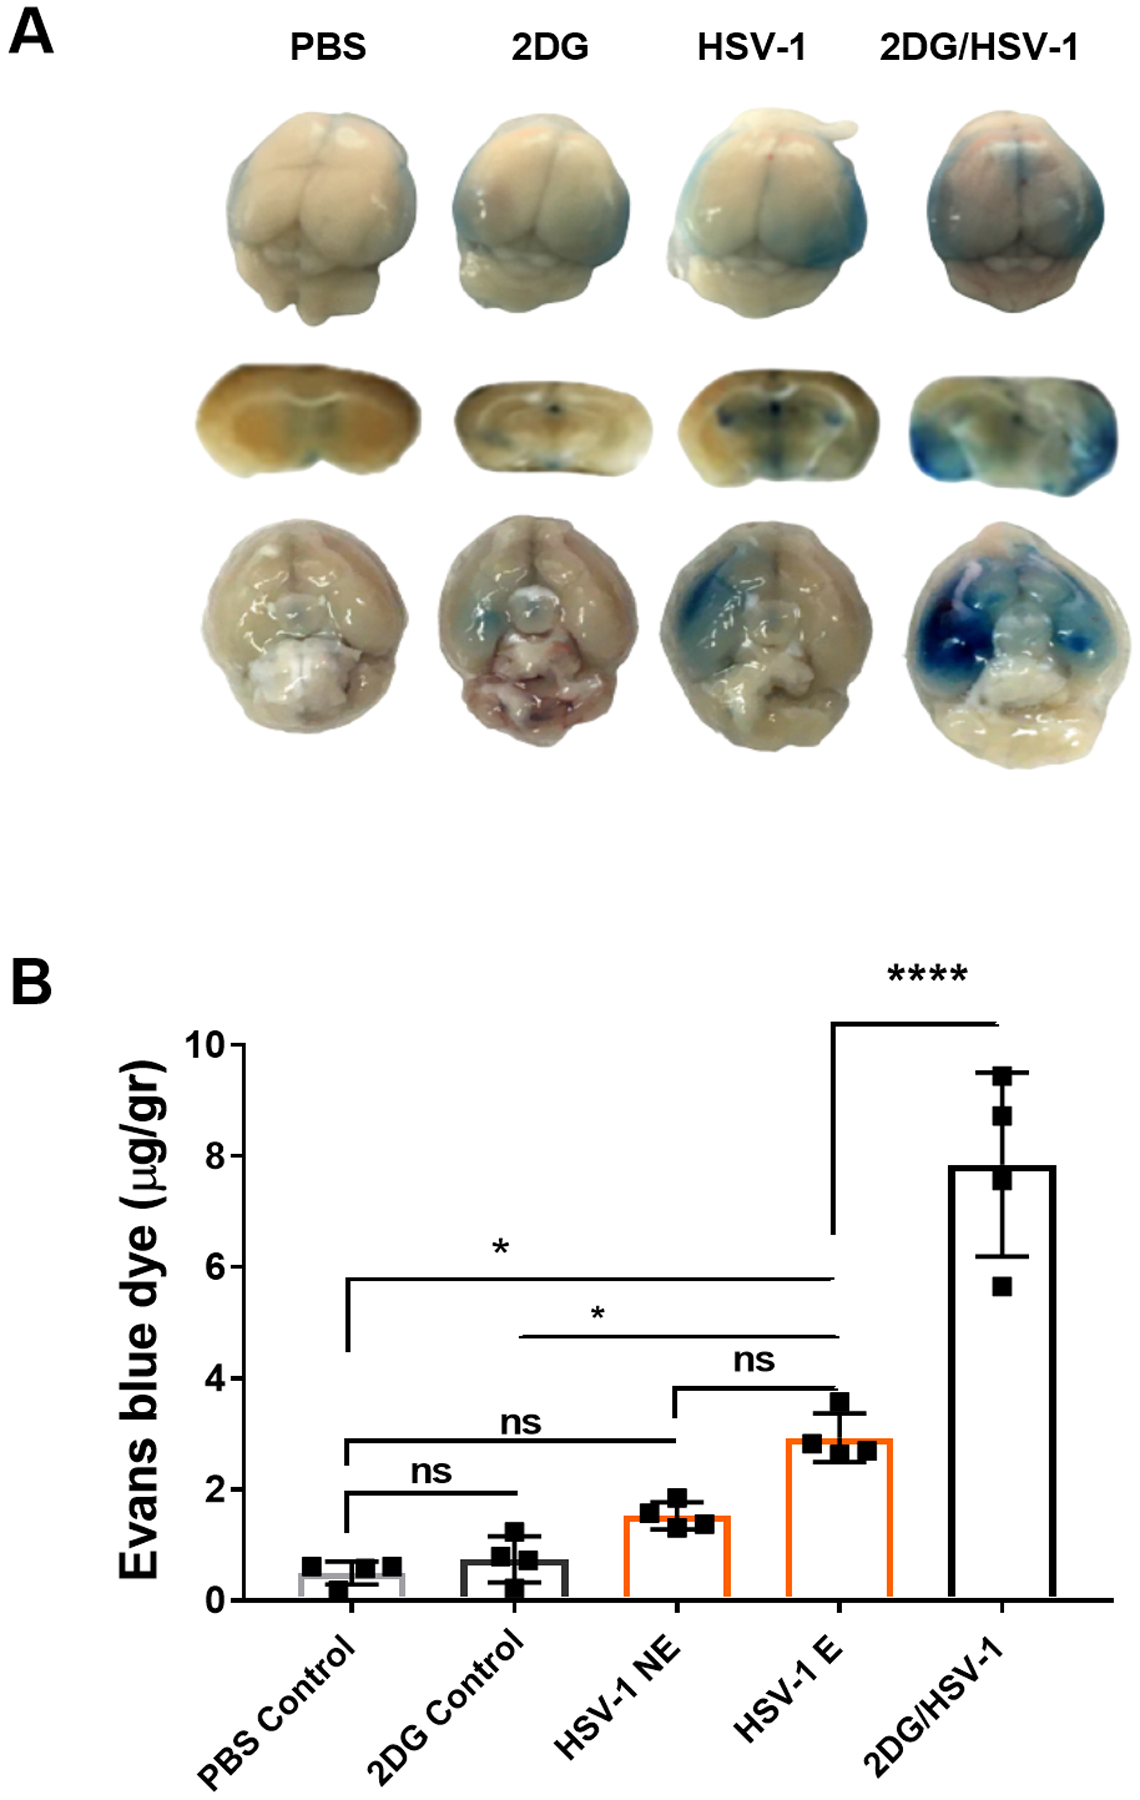
FIGURE 11.

Comparison of leakage of Evans blue into the CNS in control and 2DG treated uninfected, HSV infected untreated and 2DG treated mice. Evans blue was injected IP, 16 hr prior to recording brain images and collecting brain sample to quantify dye level. BALB/c mice received Evans blue dye by IP route a day before (overnight) on the day 8 of ocular eye infection. Brains were harvested after transcardial PBS perfusion. Panel A shows Evans blue dye leakage in mice brains from dorsal, coronal and ventral positions. Dye quantification was performed from brain and homogenate tissues with fluorescence (620 nm excitation/680 nm emission) detection by a plate reader (B). Quantification of dye was calculated per gram of brains harvested. To evaluate statistical differences of dye leakage among the groups, two-way analysis of variance (ANOVA) with multiple comparison statistical analysis was performed, followed by the Tukey test (HSV-1 E: infected encephalitis developed; HSV-1 NE: HSV infected not encephalitic; ns: not significant). *p < 0.05, ****p < 0.0001.
