
FIGURE 8.
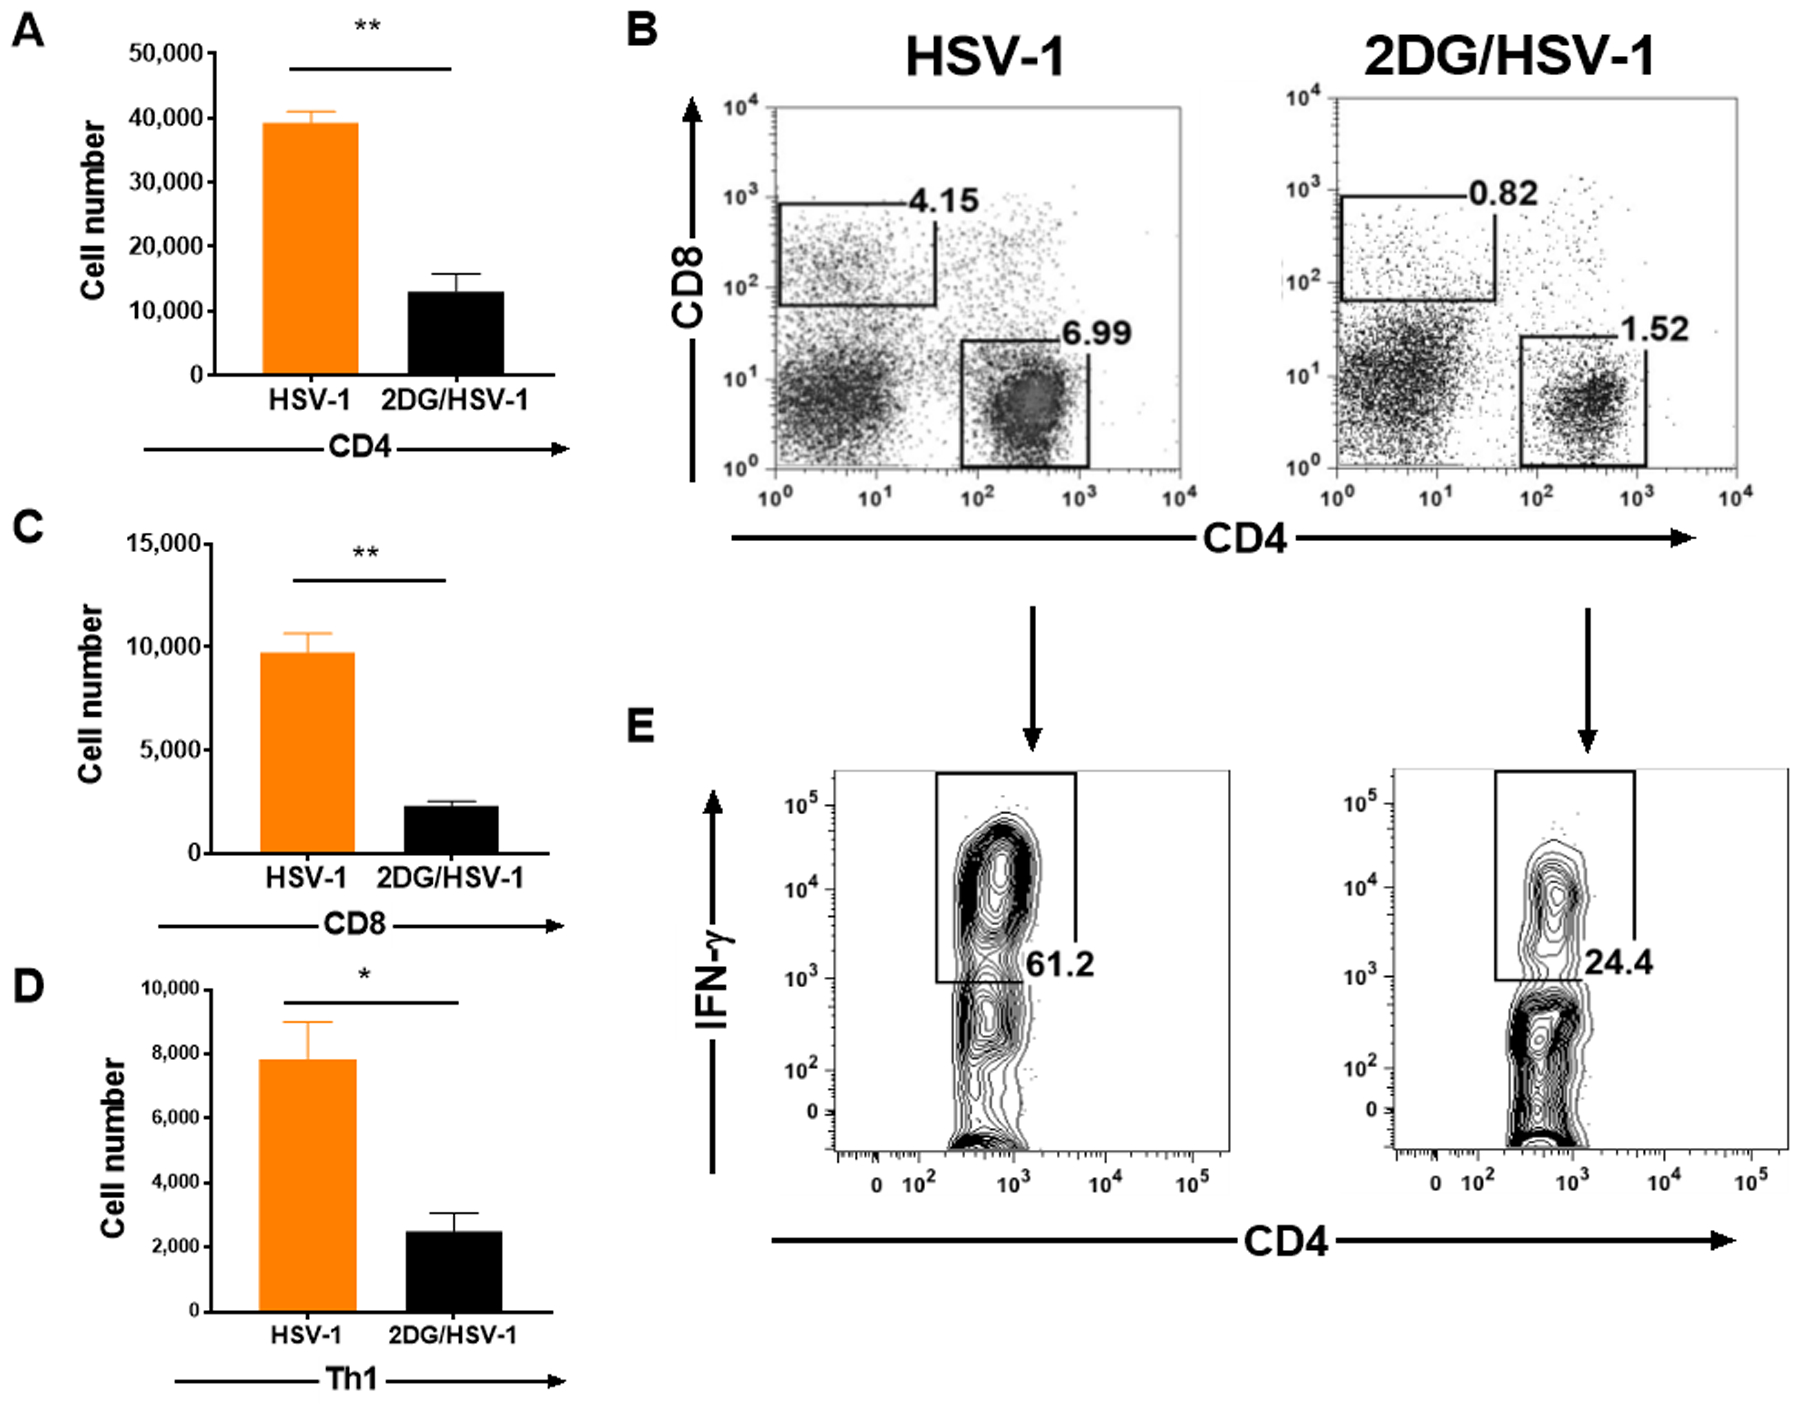
Comparison of T cell responses in the TGs from 2DG treated and untreated HSV infected mice at day 9 pi. Single cells were prepared from 8 enzymatically dissociated TGs taken from treated and untreated Balb/C mice. The number of total CD4 T cells was enumerated (A) and cell frequencies were presented in FACS plots along with CD8 T cells (B). CD8 T cells were also enumerated and presented with histograms (C). Some cultures were stimulated with PMA/Ionomycin for 4 hr to enumerate proinflammatory Th1 cell responses (CD4+IFN-γ+; panel D) and their frequencies (E). A two-tailed nonparametric Student t-test analysis was performed to estimate significant differences between 2DG treated and untreated groups (*p<0.05; **p<0.01). Error bars presenting that standard error of group medians.