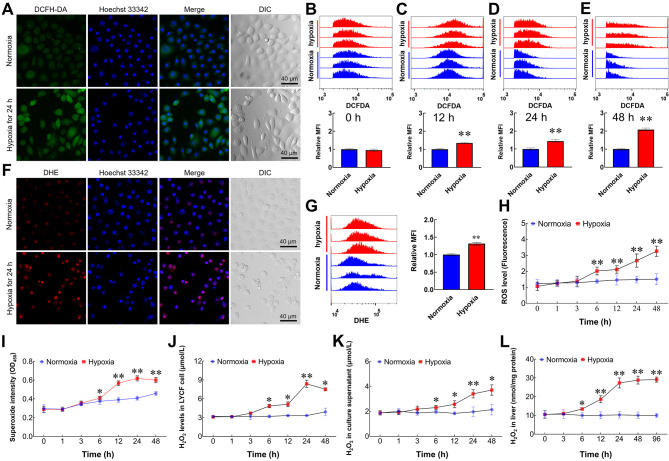
Figure 1.
Hypoxia induces an increase in ROS levels
A: Representative fluorescence photomicrographs of ROS levels (green) in LYCF cells with/without hypoxia for 24 h. DIC: Differential interference contrast. B–E: FACS analysis of ROS levels in LYCF cells with/without hypoxia for 0, 12, 24, and 48 h, respectively. MFI: Mean fluorescent intensity. F: Representative fluorescence photomicrographs of O2•− levels (red) in LYCF cells with/without hypoxia for 24 h. G: FACS analysis of O2•− levels in LYCF cells with/without hypoxia for 24 h. H: Fluorescence microplate reader measurement of changes in intracellular ROS levels (fluorescence OD value) in LYCF cells with/without hypoxia. I: Superoxide assay of changes in intracellular superoxide levels in LYCF cells with/without hypoxia. J–L: H2O2 assay of changes in H2O2 levels in LYCF cells, culture supernatant, and liver, respectively. *: P<0.05;**: P<0.01.

