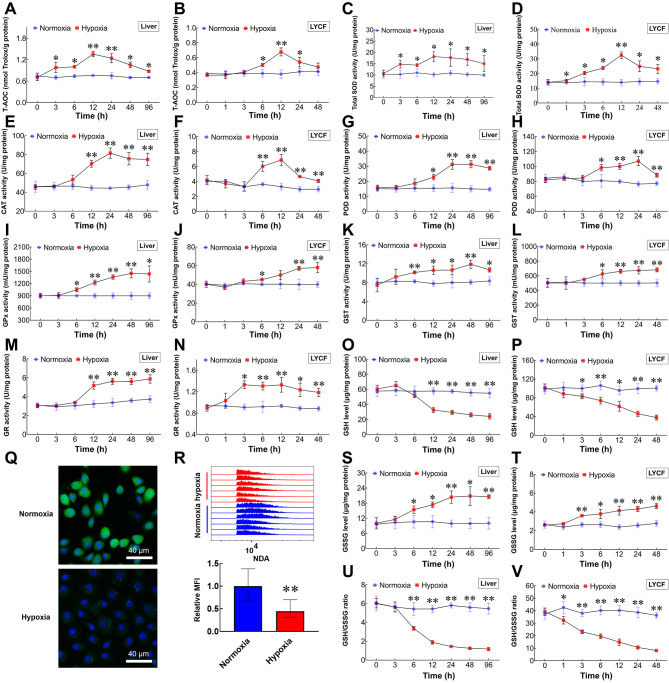
Figure 3.
Increased ROS drives antioxidant system in L. crocea and LYCF cells under hypoxic conditions
A, B: T-AOC assay of changes in T-AOC in liver and LYCF cells with/without hypoxia. C, D: Total SOD activity assay of changes in SOD activity in liver and LYCF cells with/without hypoxia. E, F: Changes in CAT activity in liver and LYCF cells with/without hypoxia. G, H: Changes in POD activity in liver and LYCF cells with/without hypoxia. I, J: Changes in total GPx activity in liver and LYCF cells with/without hypoxia. K, L: Changes in total GST activity in liver and LYCF cells with/without hypoxia. M, N: Changes in GR activity in liver and LYCF cells with/without hypoxia. O, P: Changes in GSH level in liver and LYCF cells with/without hypoxia. Q: Representative fluorescence photomicrographs of GSH level (green) in LYCF cells with/without hypoxia for 24 h. R: FACS analysis of GSH levels in LYCF cells with/without hypoxia for 24 h. S, T: Changes in GSSG levels in liver and LYCF cells with/without hypoxia. U, V: Changes in GSH/GSSG ratio in liver and LYCF cells with/without hypoxia. *: P<0.05;**: P<0.01.

