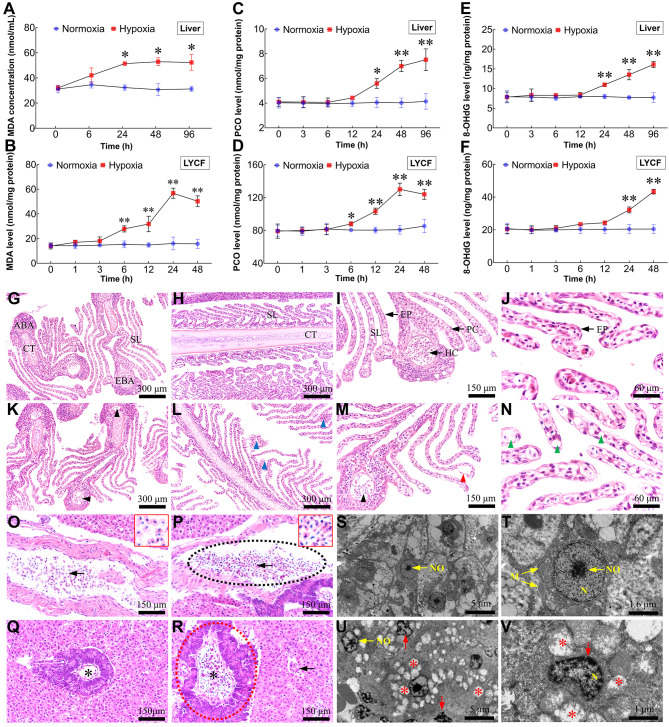
Figure 5.
Excessive ROS leads to lipid peroxidation, protein carbonylation, DNA oxidation, histopathological changes, and cellular lesions
A, B: Changes in MDA levels in liver and LYCF cells with/without hypoxia. C, D: Changes in PCO levels in liver and LYCF cells with/without hypoxia. E, F: Changes in 8-OHdG levels in liver and LYCF cells with/without hypoxia. Light micrograph sections show histological structures of gills from L. crocea under normoxic (G, H, I, and J) and hypoxic conditions (K, L, M, and N). NCGs show different components of gill filaments with normal architecture, including cartilage tissue (CT), secondary lamellae (SL), pillar cell (PC), epithelial cell (EP), efferent branchial artery (EBA), hemocyte (HC), and afferent branchial artery (ABA). HTGs show abnormal filaments; some PCs demonstrated vacuolation (green arrowhead); HCs in ABAs and EBAs decreased (black arrowhead); PCs were shed from SL (red arrowhead); partial SL were fused (blue arrowhead). G, K, I, and M show cross-section of gill filament; H, L, J, and N show vertical section of gill filament. Light micrograph sections show histological structures of L. crocea livers under normoxia (O, Q) and hypoxia (P, R). Sections from NCGs (O, Q) show normal histology, compactly arranged hepatocytes, and vessels filled with normally shaped HCs (arrow). Sections from HTGs (2.0 mg/L for 96 h; P, R) show HCs in some blood vessels are unevenly distributed and stacked together (intermittent black elliptical circle). Shape of HCs and their nuclei changed from rounded to elongated (arrow). Pancreas showed partial swelling (intermittent red elliptical circle) and number of HCs increased (asterisk). S, T: Hepatic ultrastructure in NCGs was normal, exhibiting normal mitochondria with clear cristae, and rounded and centralized nuclei and nucleoli. U, V: Pathological changes were observed in samples taken from HTGs, including regression of cristae in mitochondria, resulting in mitochondrial vacuolation (asterisk), deformed nuclei, and uneven chromatin distribution (red arrow). N (nucleus); NO (nucleoli); M (mitochondria). Red-bordered boxes in O and P show magnification of HCs. *: P<0.05;**: P<0.01.

