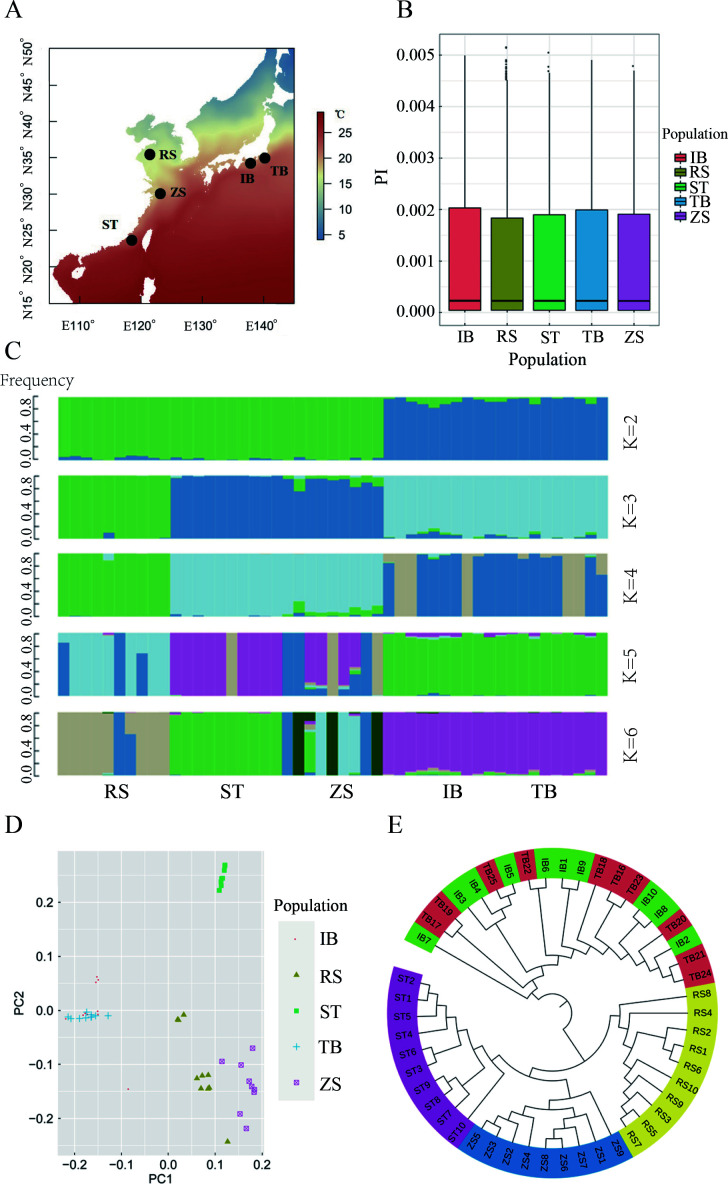
Figure 1.
Map of sampling locations and population genomic analyses of Sillago japonica
A: Map of sampling locations. Annual sea surface temperature is indicated. B: Genome-wide distribution of nucleotide diversity in 40 kb non-overlapping windows. C: Admixture analysis of five S. japonica populations. Length of each colored segment represents proportion of individual genome inferred from ancestral populations (K=2–6). D: Principal components 1 (27.80%) and 2 (16.95%) for 49 S. japonica individuals. E: Neighbor-joining tree constructed using p-distances of 49 S. japonica individuals. For abbreviations, see Table 1.

