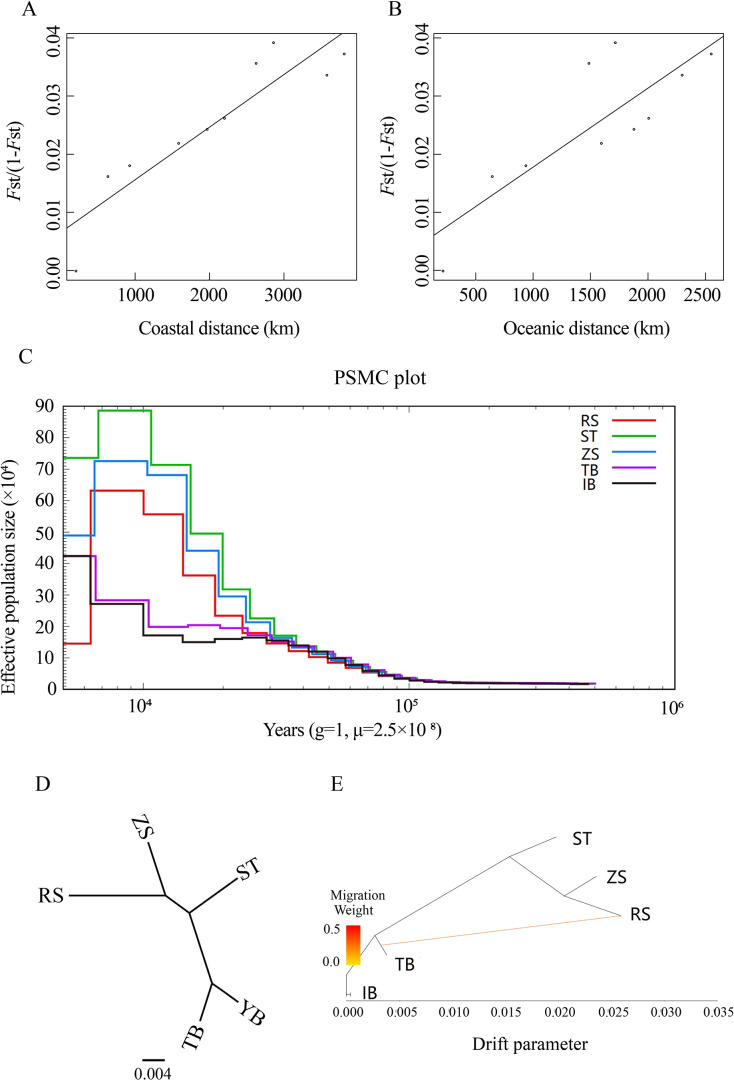
Figure 2.
Isolation by distance, demographic history, and pattern of population splits
A, B: Plot of pairwise estimates of FST/(1−FST) versus two types of geographic distance (i.e., coastal and oceanic distances) between populations. C: Demographic history for each population inferred from PSMC analysis. D, E: Pattern of population splits and mixture between five S. japonica populations. Drift parameter is proportional to Ne generations, where Ne is effective population size. Scale bar shows average standard error of estimated entries in sample covariance matrix.

