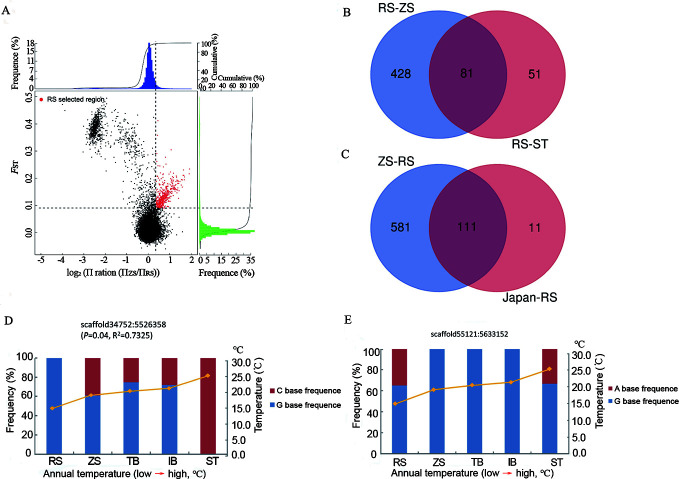
Figure 3.
Genomic regions with strong selective signals in populations of S. japonica
A: Distribution of log2(θπ ratios) and FST values calculated in 40 kb sliding windows with 20 kb increments between RS/ZS populations (ZS as control group). Data points in red (corresponding to top 5% of empirical log2[θπ ratio] distributions with values of >0.1204 and top 5% of FST distributions with values of >0.0904) are genomic regions under selection in RS population. B: Overlapping candidate genes in RS/ZS and RS/ST pairs based on Venn diagram. C: Overlapping candidate genes in ZS/RS and Japan/RS pairs based on Venn diagram. D: Allele frequency of one SNP within cold-temperature adaptation gene Picalm across five S. japonica populations, red and blue represent two types of bases at this locus. E: Allele frequencies of one SNP within warm-temperature adaptation gene SORCS3 across five S. japonica populations, red and blue represent two types of bases at this locus.

