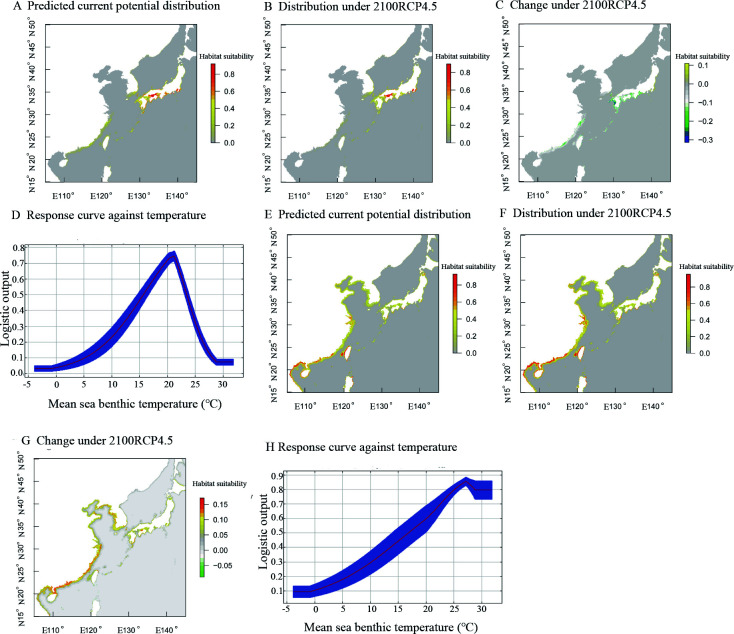
Figure 5.
Predicted potential distribution (A, B), changes in habitat suitability (C) of Chinese group under RCP45 scenarios, and response curves of predicted occurrence probability (D) of Chinese group against temperature. Predicted potential distribution (E, F), changes in habitat suitability (G) of Japanese group under RCP45 scenarios, and response curves of predicted occurrence probability (H) of Japanese group against temperature

