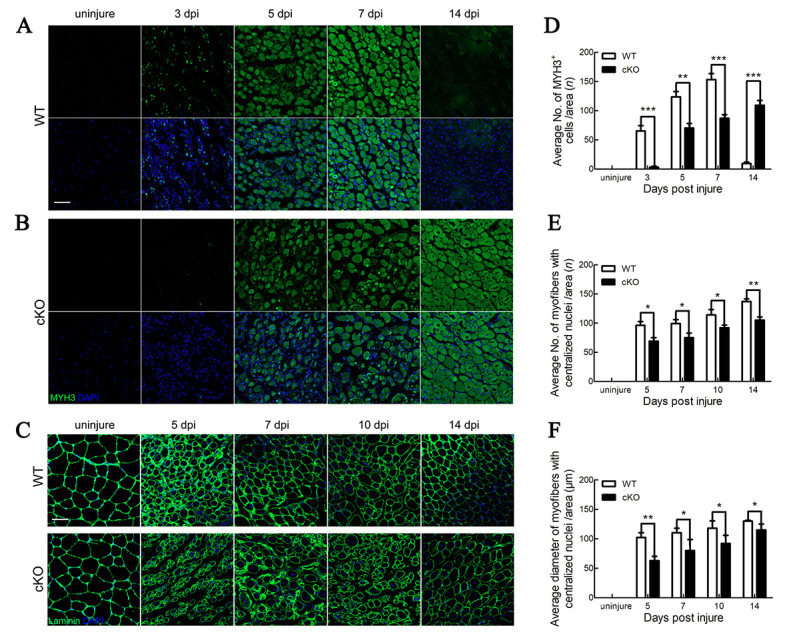
Figure 5.

Deletion of Tmem30a impaired SC proliferation
A, B: Expression of MYH3 in uninjured WT and cKO mice and in WT and cKO mice at 3, 5, 7, and 14 dpi by immunohistochemical staining. MYH3 was labeled with MYH3 antibody (green). Nuclei were counterstained with DAPI (blue). Scale bar: 50 μm. C: Immunohistochemical staining analysis of size and number of regenerating myofibers in TA muscles of uninjured WT and cKO mice and of WT and cKO mice at 5, 7, 10, and 14 dpi. Laminin immunostaining is shown in green, and nuclei are shown in blue (counterstained with DAPI). Scale bar: 50 μm. D: Average number of MYH3+ cells per field in uninjured mice and in mice at 3, 5, 7, and 14 dpi. E: Average number of regenerating myofibers per field in uninjured mice and in mice at 5, 7, 10, and 14 dpi. F: Average diameter of regenerating myofibers in uninjured mice and in mice at 5, 7, 10, and 14 dpi. Data are mean±SEM. n=3 in each group. Significance was calculated by two-tailed Student’s t-test. *: P<0.05;**: P<0.01;***: P<0.001.
