
Figure 6.
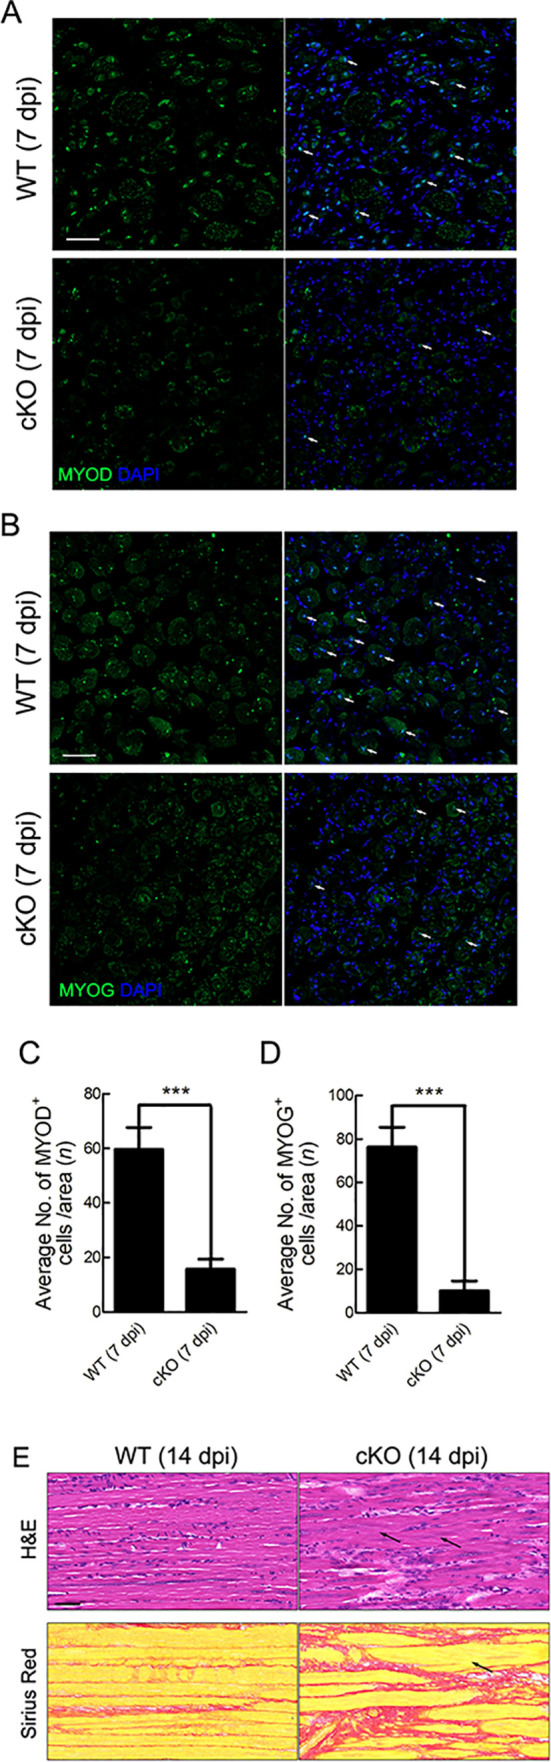
Specific deletion of Tmem30a in SCs impaired differentiation of myoblasts
A: Immunofluorescence analysis of MYOD expression in TA muscles of WT and cKO mice at 7 dpi. MYOD immunostaining is shown in green, and nuclei are shown in blue (counterstained with DAPI). Arrows depict cells positive for MYOD. Scale bar: 50 μm. B: Average number of MYOD+ cells per field at 7 dpi. C: Immunofluorescence analysis of MYOG expression in TA muscles of WT and cKO mice at 7 dpi. MYOG immunostaining is shown in green, and nuclei are shown in blue (counterstained with DAPI). Arrows depict cells positive for MYOG. Scale bar: 50 μm. D: Average number of MYOG+ cells per field at 7 dpi. Data are mean±SEM. n=3 in each group. Significance was calculated by two-tailed Student’s t-test. ***: P<0.001. E: H&E and Sirius Red staining of TA muscles from WT and cKO mice at 14 dpi. Arrows depict abnormal myofiber fusion.n=3 in each group. Scale bar: 50 μm.