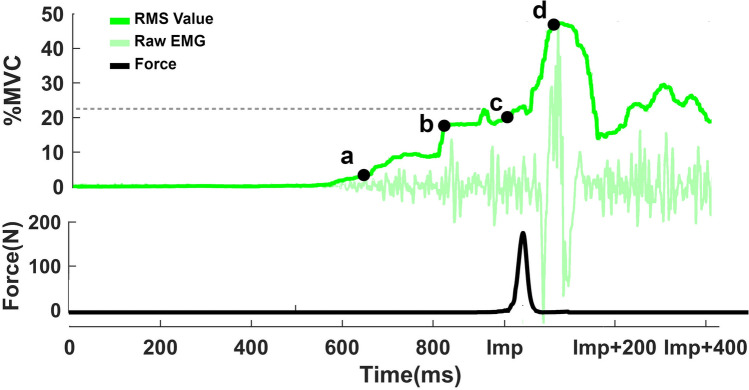
Figure 2.
A sample of EMG amplitude for the SCM muscle and the force profile in that trial. The warning started playing at Time = 0 and impact happened at the time = Imp. (a) T(Pre-Imp-Onset) represented the first time that the value of muscle activation reached 3%MVC. The dashed line indicates the absolute maximum value after the warning and before the impact for that test trial for the SCM muscle. (b) T(Pre-Imp-Max) and EMG(Pre-Imp-Max) defined when the EMG amplitude reached 70% of its maximum amplitude before the impact in that trial, (c) EMG(Imp) represented EMG amplitude at the onset of the force, and (d) T(Post-Imp-Max) and EMG(Post-Imp-Max) showed the peak EMG activation after the impact. Points a and b, T(Pre-Imp-Onset) and T(Pre-Imp-Max), times are reported based on the time of warning, t = 0. For point d, T(Post-Imp-Max), time was reported based on impact time t = Imp.

