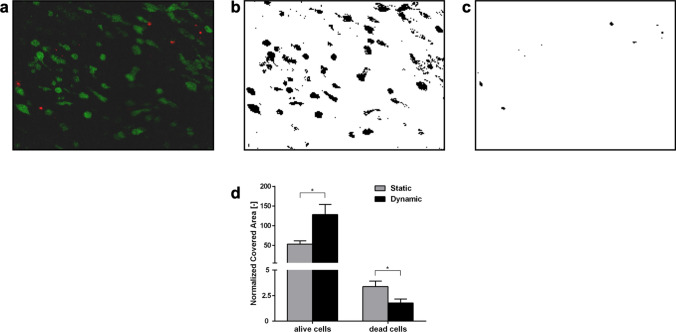
Figure 3.
LIVE/DEAD® cell viability assay. (a) Images acquired by fluorescent confocal microscopy (live cells in green, dead cells in red); (b, c) maximum entropy threshold-based image segmentation for live and dead cells respectively; (d) Quantitative analysis of the scaffold area covered by the live cells (green areas) and dead cells (red areas). Mean values and ± SD of at least 4 images for each condition and scaffold region. *p < 0.05.

