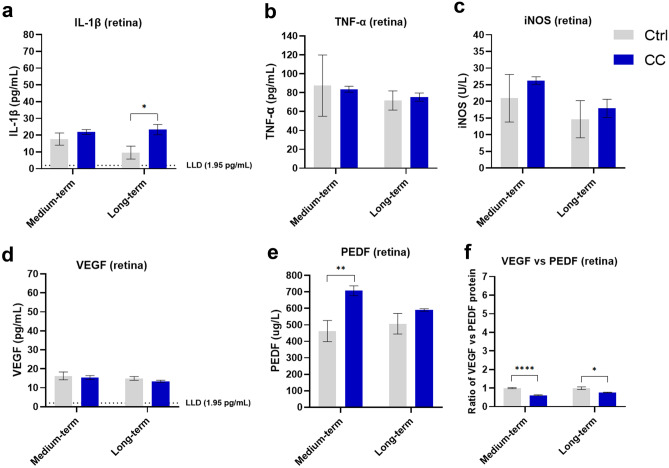
Fig. 2.
Protein levels in the retina of mice from the C-cigarette smoke exposure (medium-, long-term) subgroups. Data presented are from factors IL-1β (a), iNOS (b), TNF-α (c) and VEGF (d), and PEDF (e). Ratio of VEGF vs PEDF reflects the changes to the equilibrium of both factors at the RPE/retina interface (f) reflects the comprehensive effect of pro-angiogenic. Data are presented as mean ± SD. *P < 0.05, **P < 0.01, ***P < 0.001, ****P < 0.0001. LLD lower limit of detection

