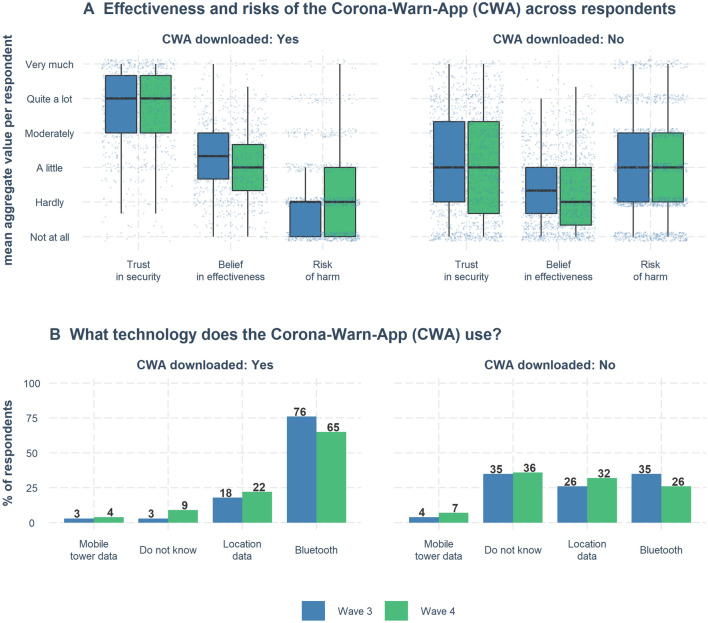
Figure 7.
Users and non-users of the Corona-Warn-App: Perception of effectiveness, risks, and understanding of technology. (A) Perception of effectiveness and risks of the Corona-Warn-App for two groups: those who had downloaded the app and those who had not. The variables “Trust in security” and “Belief in effectiveness” represent combined and averaged measures from variables presented in Fig. 6. The variable “Trust in security” combines four variables: “Only Necessary Data Collection,” “Trust: Privacy Protection,” “Trust: Security from 3rd Party.” The variable “Belief in effectiveness” combines three variables: “Reduce Likelihood to Contract,” “Reduce Spread Future,” “Return to Activity Future.” “Risk of harm” is a single variable. For items, see Appendix Tables B6 and for all aggregate measures see B10. Boxplots show distributions of aggregate (mean) values. Boxes show the interquartile range (IQR; responses between the 25th and 75th percentiles); the black horizontal line inside the boxes indicates the median value. Lower and upper whiskers extend from the hinge to the smallest and largest values within . Individual responses are jittered horizontally and vertically. (B) Understanding of the Corona-Warn-App technology. Participants who had downloaded the app were much more likely to give the correct answer: Bluetooth.

