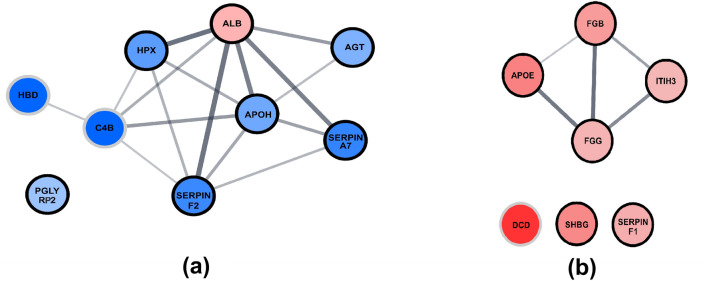
Figure 1.
The Cytoscape visualization of STRING-generated network composed of experimentally verified protein–protein interactions among the quantified proteins (a) for serum and (b) for plasma. Nodes with a bold edge correspond to proteins with statistically significant change between the groups (p value < 0.05), whereas nodes with grey edges correspond to proteins with a verified interaction with those proteins and at least twofold concentration change between the groups, which was however insignificant (p value > 0.05). The gradation of the fill corresponds to the value of the concentration fold changes, the darker the greater the change, shades of red and blue correspond to increased and decreased concentration in the test group, respectively.

