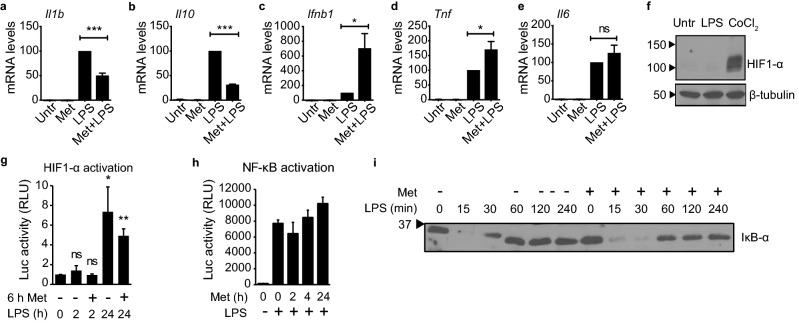
Figure 1.
Metformin alters Il1b transcript levels during the acute LPS response independently of IL-10, HIF1-α, and NF-κB. (a–e) RT-qPCR with RNA from primary BMDMs, quantifying the indicated genes. Cells were pretreated with 3 mM metformin for 6 h, followed by stimulation with 100 ng/ml LPS for 2 h (Met + LPS). Controls were either left untreated (Untr), treated with metformin but not stimulated (Met), or stimulated with 100 ng/ml LPS for 2 h in the absence of metformin pretreatment (LPS). Tubb5 served as reference gene. Error bars indicate standard error of 5 independent experiments. (f) Western blot of lysates from J774 cells treated with 100 ng/ml LPS for 2 h or with 100 μM CoCl2 for 4 h, probing for HIF1-α and β-tubulin. Black arrows indicate molecular weight in kDa. Images were cropped. See Supplementary Fig. S1f,g for full lanes. (g,h) Luciferase assay with RAW 264.7 cells (g) transiently transfected with the pGL2-HRE-Luc HIF1-α-dependent luciferase reporter construct or (h) stably transfected with the pBIIx-Luc NF-κB-dependent luciferase reporter construct. Cells were (g) pretreated or not with 5 mM metformin (Met) for 6 h and then stimulated with 100 ng/ml LPS for the indicated times up to 24 h, or (h) pretreated with 1 mM metformin (Met) for the indicated times up to 24 h and then stimulated or not with 100 ng/ml LPS for 2 h. Luc, luciferase; RLU, relative luminescence units. Error bars indicate standard deviation of (g) 5 or (h) 3 independent experiments. (i) Western blot analysis of IκB-α in lysates of J774 macrophages. Cells were treated with 10 mM metformin for 30 min and stimulated with 100 ng/ml LPS for up to 4 h. Protein concentrations in lysates were quantified and equivalent amounts loaded in each lane. Black arrow indicates molecular weight in kDa. Image was cropped. See Supplementary Fig. S1h for uncropped lanes. p-values: ***p < 0.001; **p < 0.01; *p < 0.05; ns not significant.

