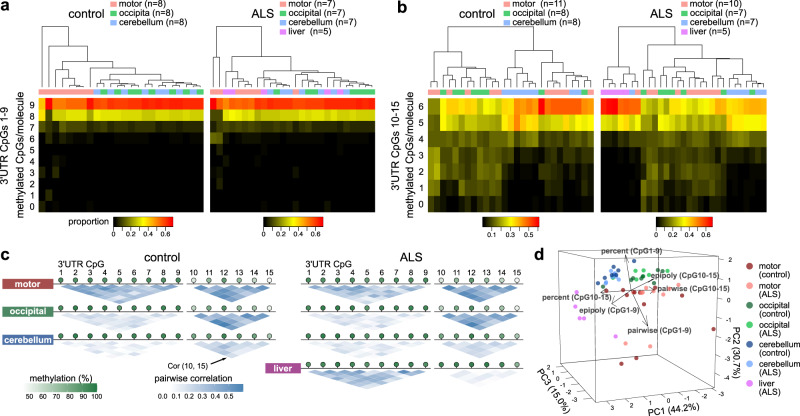
Fig. 5. DNA methylation status of TARDBP in different brain regions and liver tissues.
a, b Proportions of the number of sequence reads classified by the number of CpGs methylated among nine CpG sites (3′UTR CpGs 1–9) or six CpG sites (3′UTR CpGs 10–15). c Methylation-linkage diagram of 3′UTR CpGs 1–9 and 3′UTR CpGs 10–15 showing the correlation of all CpG-site pairs in the target region. Green circles indicate the mean percentage of DNA methylation at each CpG site. d Principal component analysis using the mean methylation percentages, mean pairwise correlations, and epipolymorphism scores in 3′UTR CpGs 1–9 and 3′UTR CpGs 10–15. Eleven controls and 10 ALS patients were included in the analysis of 3′UTR CpGs 10–15 in the motor cortex, five ALS patients were included in the analysis of the liver, and seven ALS patients and eight controls were included in the other analyses.

