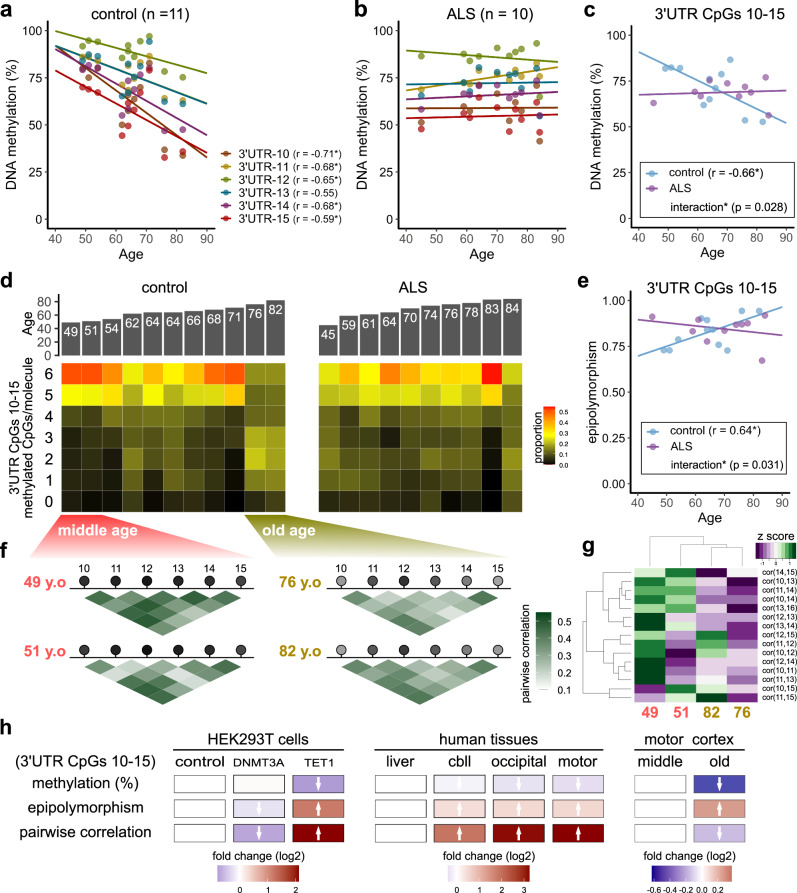
Fig. 6. Effect of aging on the DNA methylation status of the TARDBP 3′UTR in the motor cortex.
a, b Scatter plot showing the percentage of DNA methylation at each CpG site among TARDBP 3′UTR CpGs 10–15 according to age at autopsy (Pearson’s correlation test) in the control (a) and ALS (b) groups. c Scatterplot showing the average DNA methylation of 3′UTR CpGs 10–15 according to age at autopsy in the controls (Pearson’s correlation test). d Proportions of the number of sequence reads classified by the number of methylated CpGs among the six CpG sites (3′UTR CpGs 10–15) in the controls and ALS patients. e Correlation between age at autopsy and the epipolymorphism scores of 3′UTR CpGs 10–15 (Pearson’s correlation test). f, g Methylation-linkage diagram of 3′UTR CpGs 10–15 in two of the youngest and two of the oldest individuals analyzed (f) and heat map (g) showing the extent of the pairwise correlation of each CpG pair. h For each DNA methylation profile, the effects of the targeted manipulation of DNA methylation, differences according to brain region, and the effect of aging are shown as fold changes (log2) relative to the experimental control, liver, and middle-aged group results, respectively.

