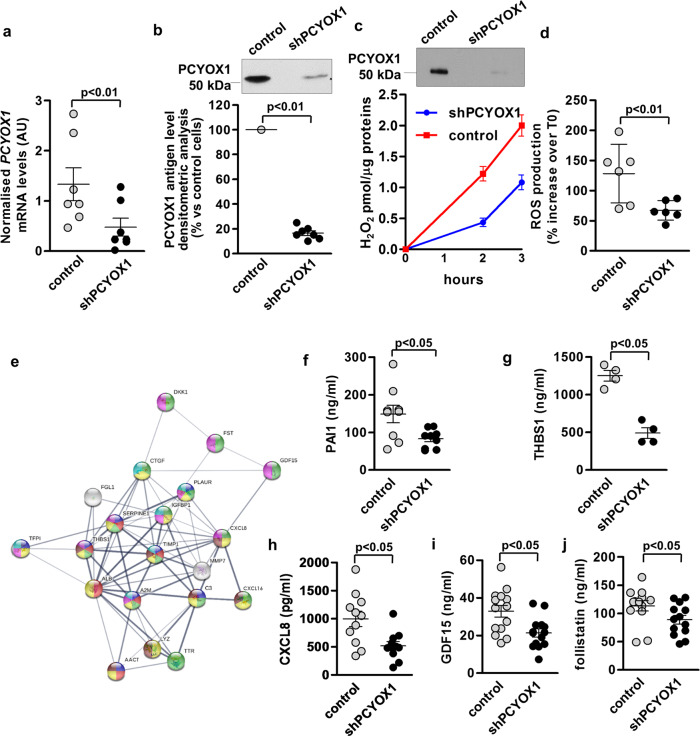
Fig. 2. PCYOX1 silencing affects the cellular proteome.
PCYOX1 mRNA normalized to the housekeeping gene 18S rRNA (a, n = 7) and protein (b, n = 7) in PCYOX1-silenced HepG2 cells (shPCYOX1). p < 0.01 vs control cells by Student’s t test. c PCYOX1 immunoblotting (upper panel, n = 7) and H2O2 production (lower panel, n = 3) of apoB100-containing lipoproteins isolated from control or shPCYOX1 cell conditioned media. Data are expressed as mean value ± SEM of H2O2 pmol/µg proteins over time. d ROS production in PCYOX1-silenced HepG2 cells (n = 6). p < 0.01 vs control cells by Student’s t test. e GO analysis of secreted proteins downregulated by PCYOX1 silencing highlighting enriched biological processes: blue, negative regulation of peptidase activity; red, platelet degranulation; green, regulation of signal transduction; yellow, response to stress; violet, negative regulation of response to stimulus; brown, inflammatory response; light blue, response to wounding. f–j Levels of PAI-1, THBS1, CXCL8, GDF15, and Follistatin measured by ELISA. n > 4. p < 0.05 vs control cells by Student’s t test. Data are presented as circle plot, with each circle representing an individual sample and bars showing the mean value ± SEM.

