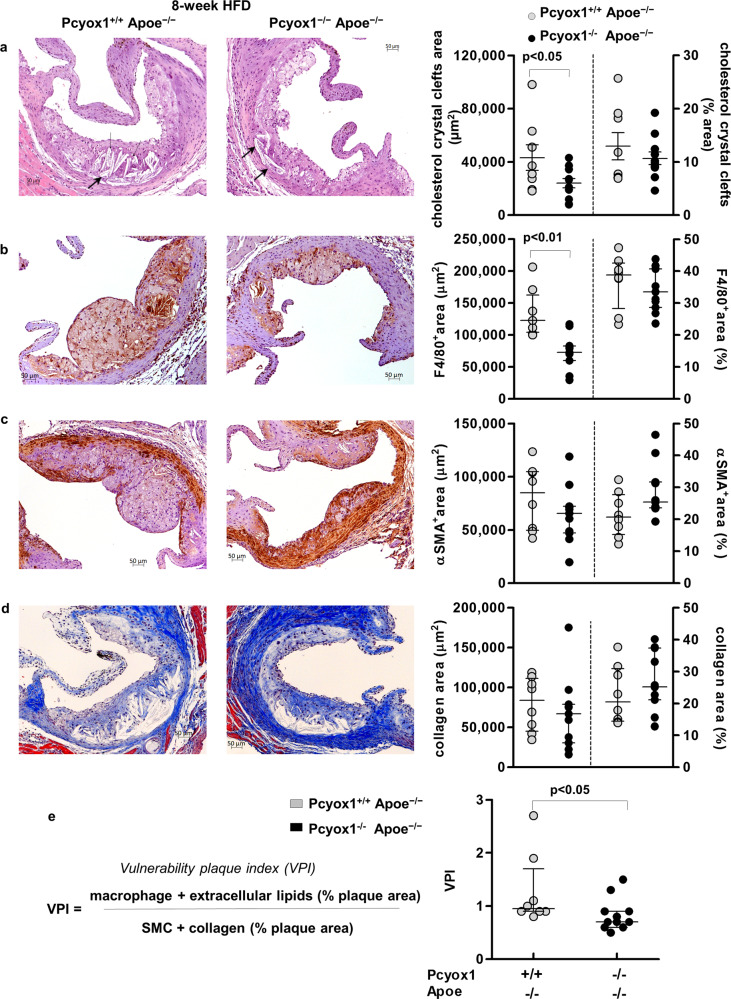
Fig. 5. Pcyox1 deficiency is associated with reduced lesion vulnerability.
Representative images and quantification of: a cholesterol crystal clefts, indicated by arrows (H&E staining); b macrophages (F4/80 staining); c α-smooth muscle cells (α-SMA staining); d collagen (Masson’s Trichrome staining) in atherosclerotic lesions from aortic roots of Pcyox1+/+/Apoe−/− (n = 8) and Pcyox1−/−/Apoe−/− (n = 11) mice fed a HFD for 8 weeks. Shown on the right are the results of the morphometric analysis for the different stainings, expressed either as absolute positive areas within the intima or as percentage of plaque that stained for each component. e Calculation of vulnerability plaque index. Data are presented as circle plot, with each circle representing an individual sample and bars showing the mean value ± SEM (a) or median with interquartile range (b–e). Statistical significance was calculated by Student’s t test (a) or Mann–Whitney test (b–e).

