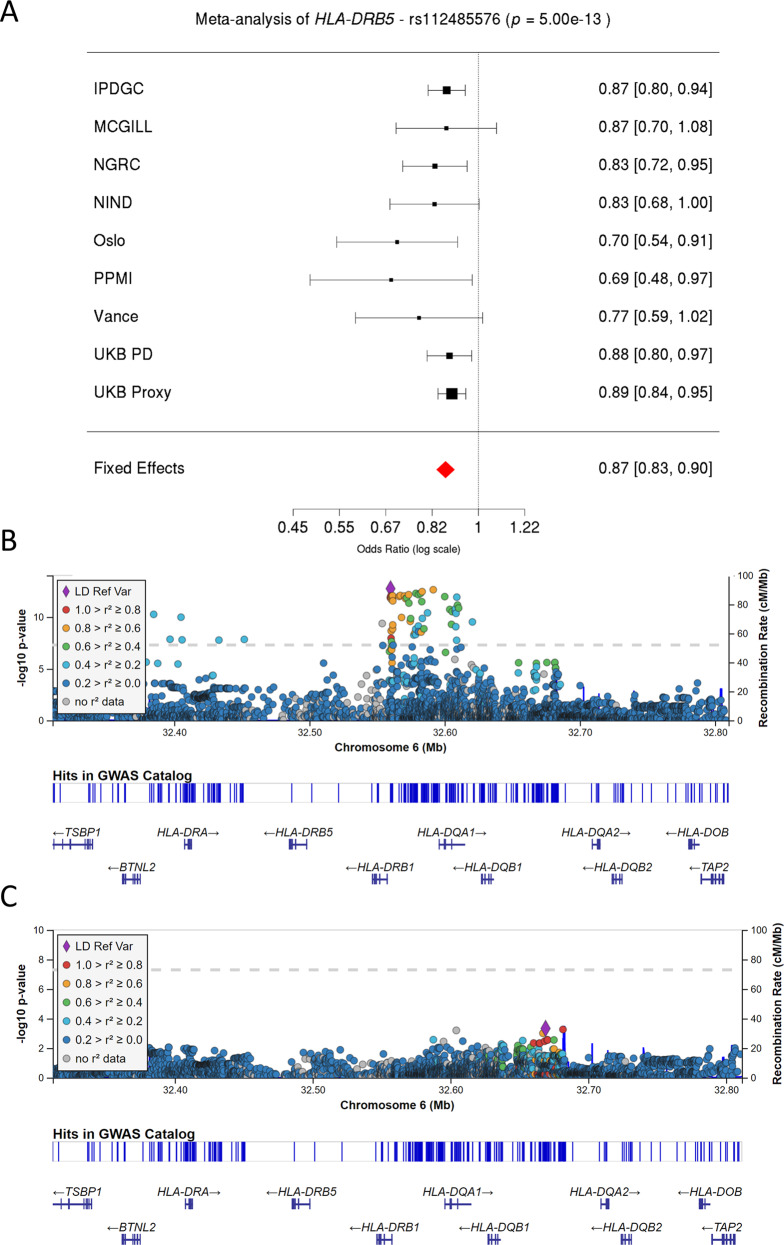
Fig. 1. Validation of previously associated top HLA locus SNP (rs112485576) in our cohort.
A Forest plot describing the effect size and 95% confidence interval of rs112485576 for each cohort and fixed-effect meta-analysis. B, C Two LocusZoom plots highlighting the significant variants before (B) and after (C) the conditional analysis on rs112485576. Dashed lines correspond to the significance threshold. Linkage disequilibrium values are shown with respect to the most significant SNP in the locus.

