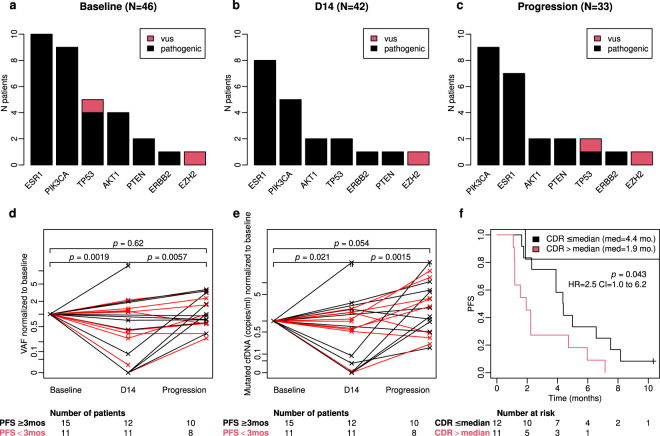
Fig. 3. Dynamic assessment of mutations in ctDNA during treatment with exemestane-everolimus.
a, b, c Somatic mutations detected in ctDNA at three different time-points during treatment with exemestane-everolimus: baseline (a), 14 days after treatment initiation (b), and at progression (c). vus = variant of unknown significance; prog = progression. d-Variant allele frequency (VAF) of SNVs (single nucleotide variants) and their evolution between three different time points (baseline, D14, and progression). VAF values are normalized to baseline. Black lines depict patients who had a PFS ≥ 3 months; red lines depict patients who have a PFS <3 months. The number of patients in each group and time-point are presented under the X-axis. e: Evolution of mutant cfDNA (cell-free DNA) copies (expressed in copies/ml of plasma) during exemestane-everolmus treatment. We note a significant decrease of mutated cfDNA between baseline and D14. Black lines depict patients who had a PFS ≥3 months; red lines depict patients who have a PFS < 3 months. The number of patients in each group and time-point are presented under the X-axis. f: Kaplan–Meier plots of PFS according to Circulating cfDNA ratio (CDR). CDR is a ratio of cfDNA copies/ml of all somatic mutations detected on D14 and baseline. Log-Rank P values and LogRank Hazard ratios and 95% Confidence intervals for LogRank Hazard ratios for each test are displayed in each corresponding panel. For each group the number at risk is presented under the X-axis.

