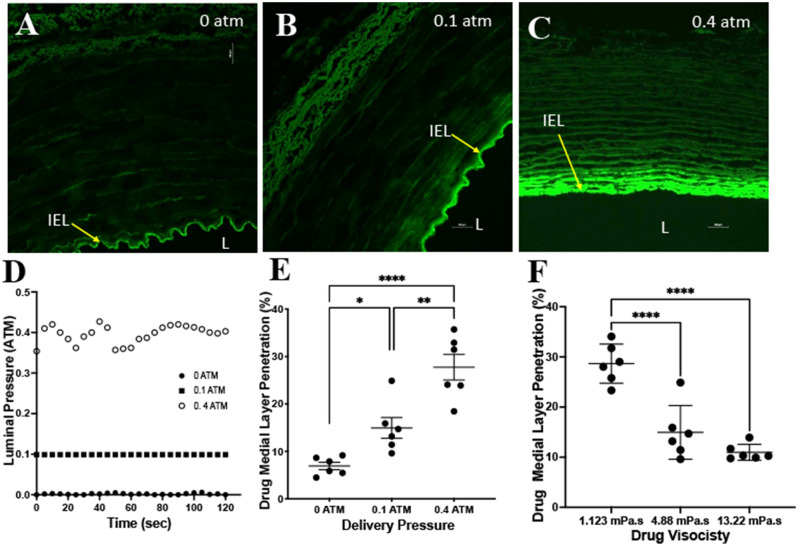
Figure 2.
Ex vivo results of varying pressures and viscosities. (A–C) Representative confocal images demonstrating the penetration of the fluorescent drug at luminal pressures of 0 atm, 0.1 atm and 0.4 atm. Yellow arrow denotes the internal elastic lamina (IEL) and L represents the lumen of the artery. (D) Representative luminal pressure measurements during the two-minute drug delivery. (E) Drug medial layer penetration comparisons between the varying luminal pressures. (F) Drug medial layer penetration comparisons between varying liquid drug viscosities. *P < 0.05, **P < 0.01, ****P < 0.0001, n = 6.

