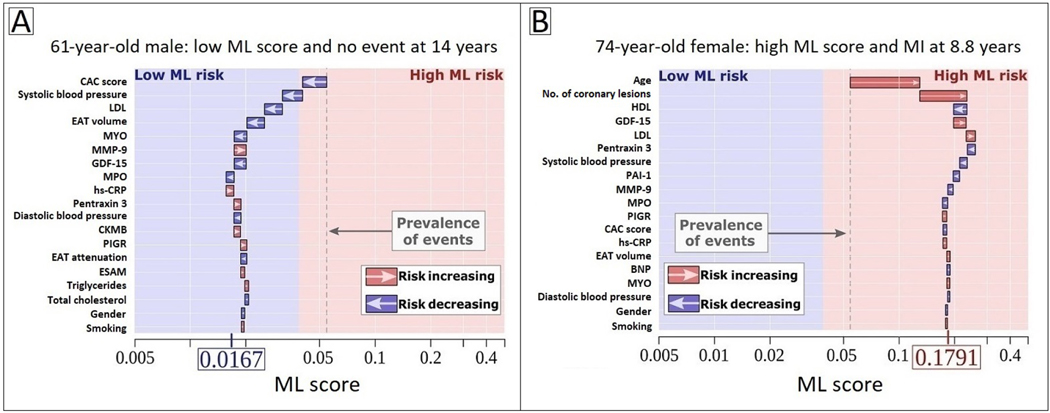
Figure 5. Explainable AI through individualized machine learning risk prediction.
(A) 62-year-old male with no event at 14 years and (B) 74-year-old female with an MI at 8.8 years. The X-axis denotes the ML risk score which is the predicted probability of events. The arrows represent the influence of each variable on the overall prediction; blue and red arrows indicate whether the respective parameters decrease (blue) or increase (red) the risk of future events. The combination of all variables’ influence provides the final ML risk score. The subject in (A) has a low ML risk score (0.0167), with an ASCVD risk score of 7.25% and CAC score of 0. The subject in (B) has a high ML risk score (0.1791), with an ASCVD risk score of 30.4% and CAC score of 324. The blue and red background colors indicate low versus high ML risk according to study-specific threshold, and the gray dashed line corresponds to the base risk obtained from the prevalence of events in the population (4.7%). Reproduced with permission from Tamarappoo et al.49
Abbreviations: ASCVD, atherosclerotic cardiovascular disease; BNP, brain natriuretic peptide; CAC, coronary artery calcium; CKMB, creatine kinase MB; CRP, C-reactive protein; EAT, epicardial adipose tissue; ESAM, endothelial cell-selective adhesion molecule; GDF-15, growth differentiation factor 15; HDL, high-density lipoprotein; LDL, low-density lipoprotein; MCP-1, monocyte chemoattractant protein 1; ML, machine learning; MMP-9, matrix metalloprotease 9; MPO: myeloperoxidase; PAI-1, plasminogen activator inhibitor 1; PIGR, polymeric immunoglobulin receptor.

