Figure 4.
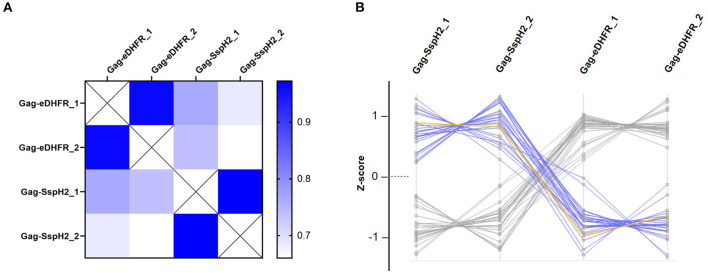
Quality control and data exploration of Virotrap samples. (A) Heat map visualization of pairwise LFQ Pearson correlations were calculated for duplicate (annotated “_1” and “_2”) Virotrap control (Gag-eDHFR) and effector (Gag-SspH2) samples. (B) Profile plots of significantly enriched protein identifications are shown after z-scoring of corresponding (imputed) LFQ intensities in the Virotrap samples. Proteins uniquely identified in the Virotrap control samples were excluded from the statistical analysis and are not shown in the profile plot. Blue highlighted lines represent significant hits co-enriched with Gag-SspH2 (yellow line) vs. the Virotrap Gag-eDHFR control setup (Limma, p-value < 0.05).

