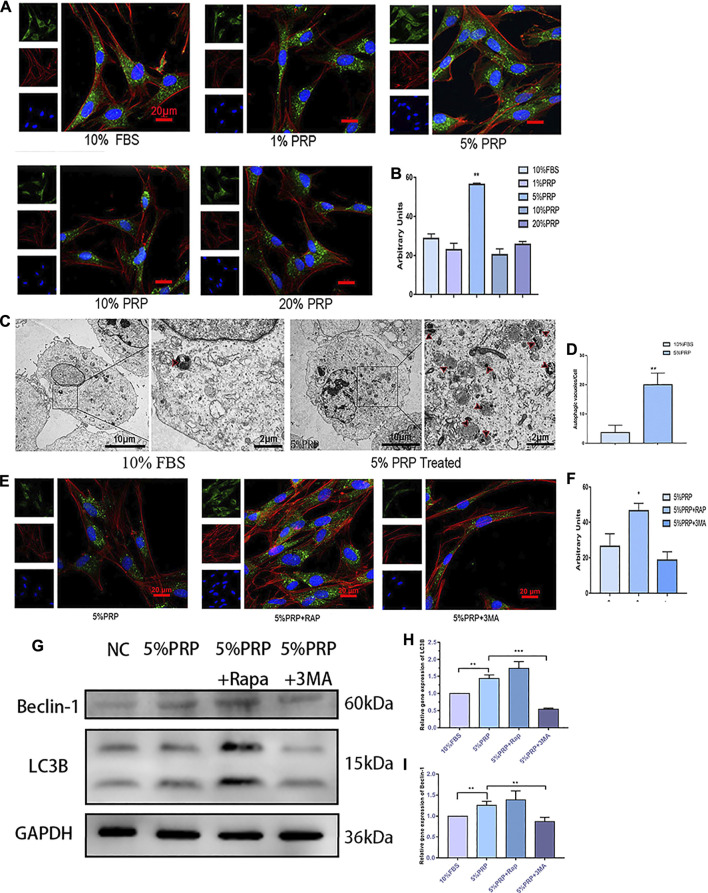
FIGURE 3.
(A) Autophagy activation by PRP. By immunofluorescence staining, 5% PRP obviously increased the expression of LC3B (scale bar, 20 μm). (B) The graph shows the quantitative analysis of LC3B fluorescence by Image J. (C) By transmission electron microscope, 5% PRP-treated hDPCs showed a large number of autophagic vacuoles. (D) The number of autophagic vacuoles per cell. Experiments were repeated three times. (E) Immunofluorescence staining of autophagy-associated protein was elevated by rapamycin, whereas it was reduced by 3-MA (scale bar, 20 μm). (F) Quantitative analysis of LC3B fluorescence was estimated by Image J. (G) Western blot analysis of the autophagy-associated proteins levels in the hDPCs treated with 5% PRP, rapamycin (RAP) (100 nM) + 5% PRP, or 3-methyladenine (3-MA) (5 mM) + 5% PRP for 24 h. (H) LC3B and Beclin-1(I) mRNA expression were analyzed by quantitative PCR. Data in (B), (C), (D), (F), (H), and (I) are presented as mean ± standard deviation. Significantly different groups, *p < 0.05, **p < 0.001.

