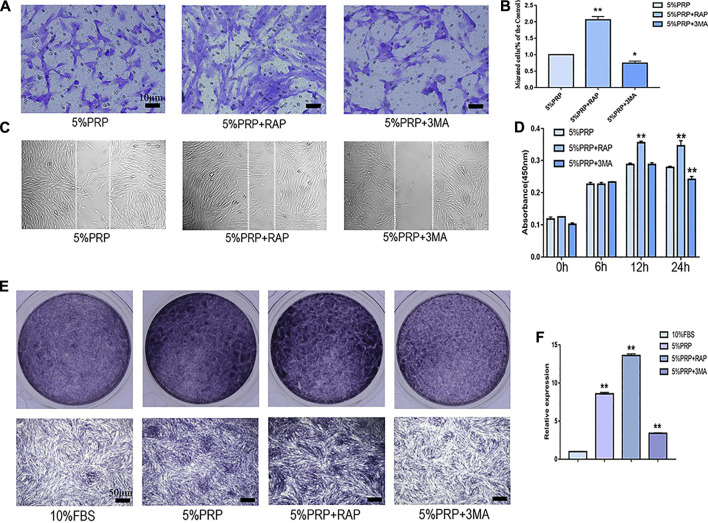
FIGURE 4.
Cell migration, proliferation, and osteogenic differentiation were suppressed by autophagy inhibitor and promoted by autophagy agonist. hDPCs were treated with 5% PRP, rapamycin (RAP) (100 nM) + 5% PRP, or 3-methyladenine (3-MA) (5 mM) + 5% PRP. (A) By transwell assay, representative images of the migrated cells in different groups (scale bar, 10 μm). (B) The graph shows the number of migrated cells in different groups by transwell assay. (C) Representative images of the migrated cells were evaluated by scrape assay. (D) The CCK-8 assay was used to assess the proliferation ratio up to 24 h. (E) ALP staining of the four groups on day 7 (scale bar, 50 μm). (F) ALP mRNA expression was analyzed by quantitative PCR. Experiments were repeated three times. Data in (B), (D), (E) are presented as mean ± standard deviation. Significantly different groups, *p < 0.05, **p < 0.001.

