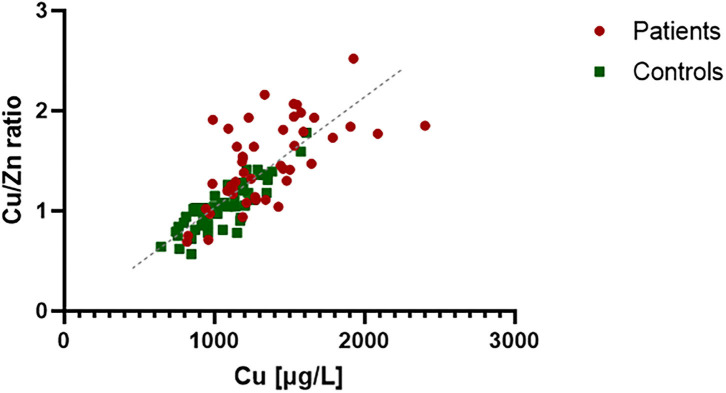
Figure 2.
Correlation analysis between Cu and Cu/Zn ratio in plasma of PTC patients and healthy controls. The control group expressed a strong correlation (R2 = 0.85), which reflect Zn regulation in the body (x/y = Zn). Zn concentration in PTC plasma seems to be less regulated and variable compared to controls (R2 = 0.39).

