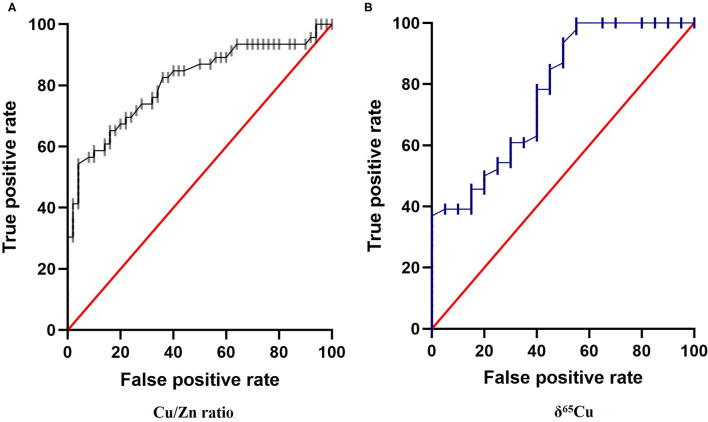
Figure 4.
Receiver Operating Characteristics (ROC) curve for: (A) Cu/Zn Ratio and (B) δ65Cu in the plasma of papillary thyroid carcinoma. We place the True Positive decision on the ordinate axis and False Positive rate on the abscissa to form the ROC diagram. The area under the ROC curve (AUC) obtained for the present data were 0.81 and 0.78, respectively (p < 0.001) supports the hypothesis that Cu/Zn ratio and δ65Cu have a strong potential to be a novels biomarker in diagnosis for thyroid cancer.

