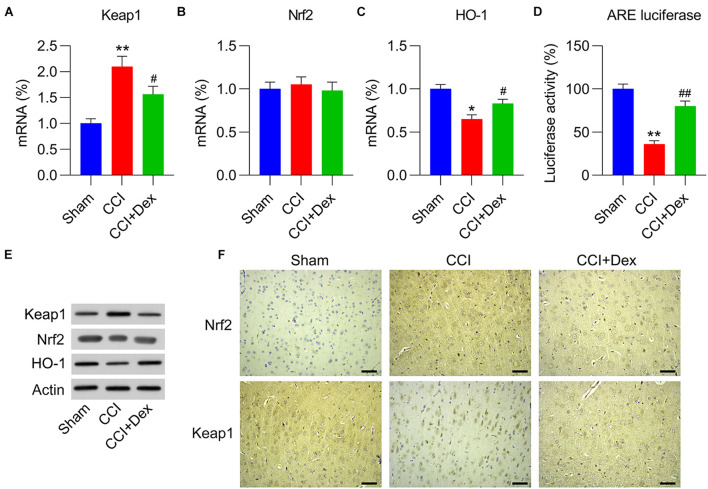
FIGURE 3.
Role of Dex in Keap1–Nrf2 pathway expression and activation in CCI-induced rats. (A,B) mRNA expression levels of Keap1 and Nrf2 were measured using quantitative polymerase chain reaction (qPCR). (C) mRNA expression levels of HO-1 were measured using qPCR. (D) Isolated microglia were transfected with ARE luciferase vector, followed by determination of luciferase activity in the cells at 36 h after transfection. (E) Protein expression levels of Nrf2, Keap1, and HO-1 were measured using western blotting. (F) Immunohistochemical staining of Keap1 and Nrf2 expression in spinal cord tissues. Scale bar, 50 μm. *P < 0.05, **P < 0.01 vs. Sham group; #P < 0.05, ##P < 0.01 vs. CCI group.

