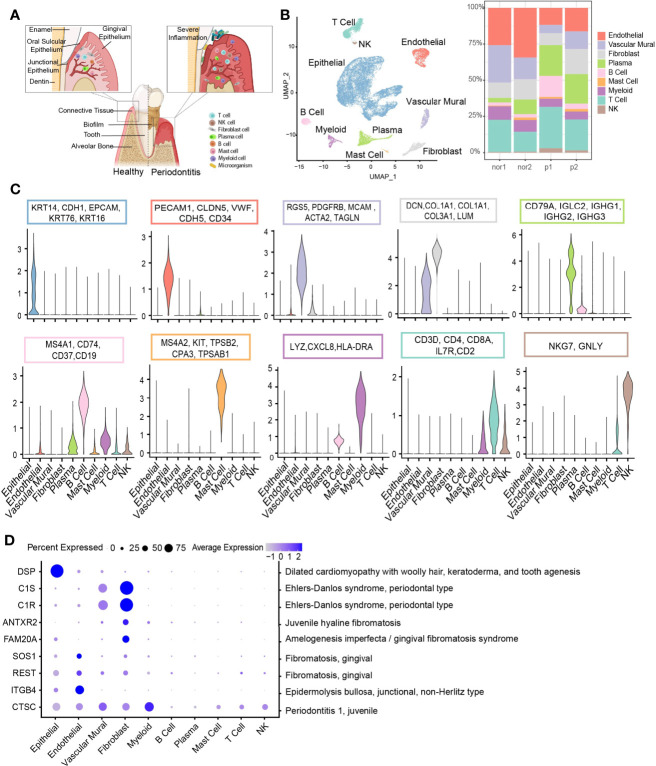
Figure 1.
Overview of the clustering and annotation of the single-cell RNA sequencing data for gingival tissues. (A) Schematic of gingival tissues in health (left) and periodontitis (right) analyzed in this study (The graph was created with BioRender.com). (B) UMAP representation of major cell types identified by scRNA-seq (n = 4; 29,967 cells; left) and bar plots indicating the percentage of the nonepithelial of subtypes in each donor (Nor1 and Nor2 are healthy donors; P1 and P2 are periodontitis patients; right). (C) Violin plots showing the expression scores of selected canonical marker gene sets across all 10 subsets. (D) Dot plot depicting gene expression levels and percentage of cells expressing genes associated with periodontal disease according to the OMIM database.

