Figure 2.
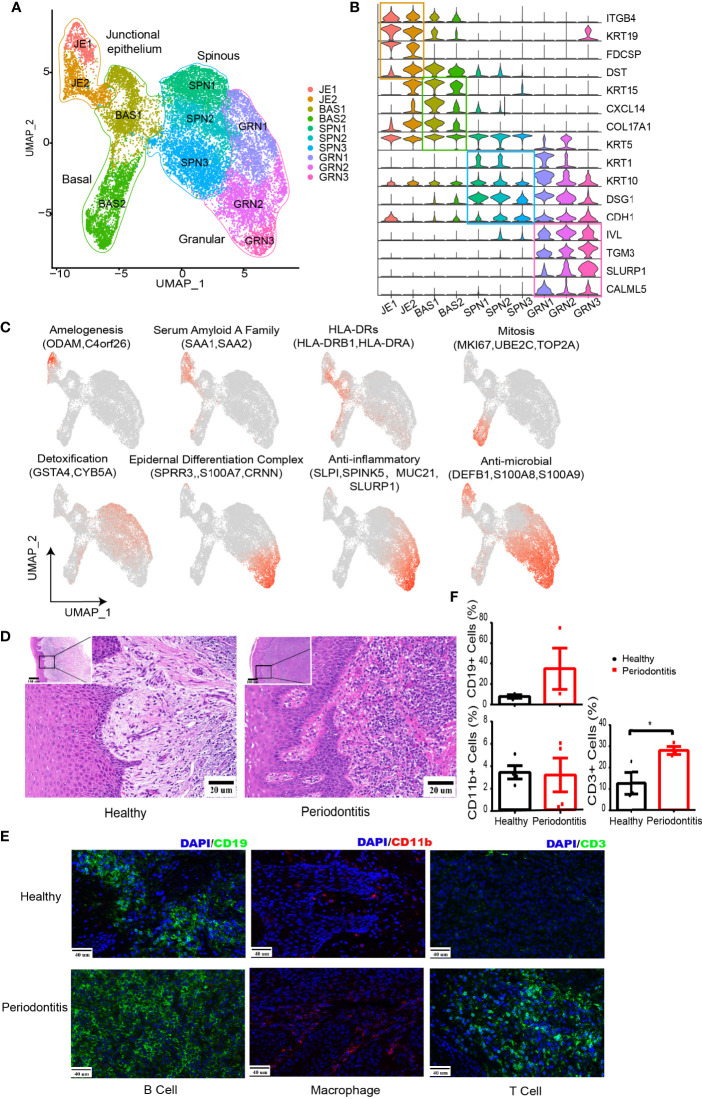
Changes in the microenvironment within human gingival tissue in periodontitis. (A) UMAP representation for human gingival epithelial cells in the combined health (n = 2; 18,012 cells) and periodontitis (n = 2; 502 cells) dataset. (B) Violin plots showing expression levels of cluster-defining genes for epithelial subsets. Expression values are normalized and scaled averages. (C) UMAP plots displaying functional molecule scores in the epithelial cells of all subpopulations. Red indicates maximum expression, and grey indicates low or no expression of each particular set of genes in log-normalized UMI counts. (D) H&E staining of the representative gingival tissue from health (left) and periodontitis (right) sections. Scale bar: 20 μm. (E) Representative immunofluorescence (IF) staining for CD19+ B cells (green, one column), CD11b+ macrophages (red, two columns), and CD3+ T cells (green, three columns) with DAPI (blue) in gingival sections of healthy (top) and periodontitis patients (bottom). Images were acquired at ×40 magnification (scale bar: 40 µm). (F) Bar graphs demonstrate percentage of CD19+ B cells (left top), CD11b+ macrophages (left bottom), and CD3+ T cells (right bottom) in gingival sections of healthy (n = 4) and periodontitis patients (n = 4) based on immunofluorescence analysis. The number of cells is counted based on five different limited areas on a slide from one sample then the mean was calculated. One dot per individual. Small horizontal lines indicate the mean (± s.d.). *p ≤ 0.05, as determined by Student’s t-test.

