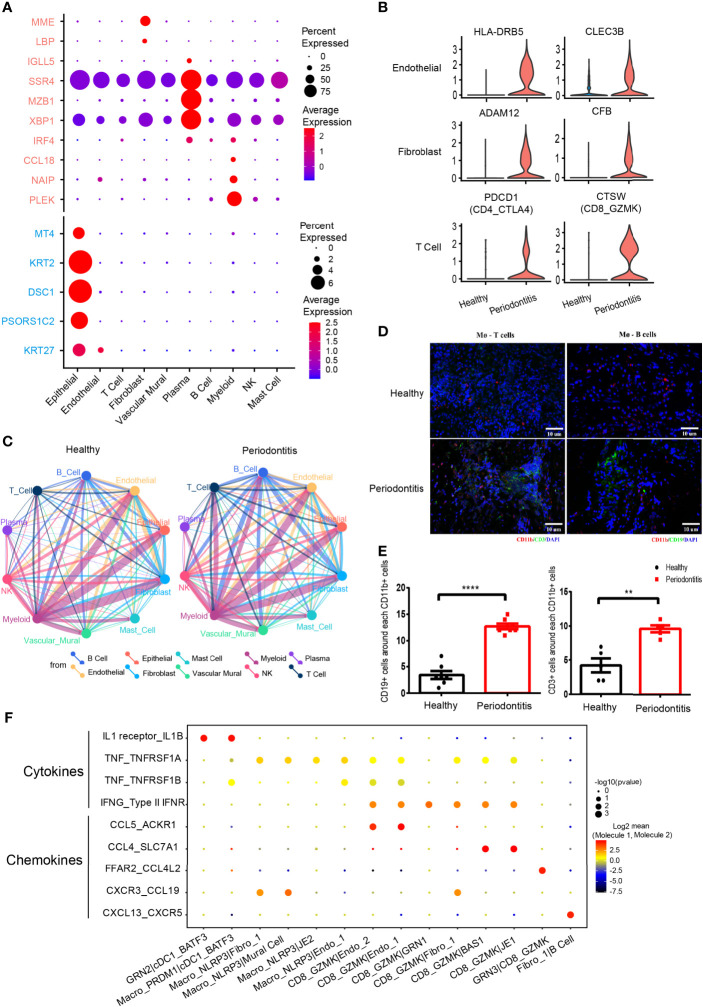
Figure 3.
Differentially expressed genes and cell-cell interactions in health and periodontitis. (A) Bubble heatmap showing cellular expression patterns of genes associated with periodontitis based on previous bulk RNA sequencing. Rose stands for reported upregulated genes in periodontitis, and turquoise stands for reported downregulated genes in periodontitis. Dot size indicates fraction of expressing cells, colored according to z-score-normalized expression levels. (B) Violin plots showing the expression of specifically increased genes in different cell clusters in periodontitis. The gene expression levels are normalized and transformed as ln (CPM/10). (C) Cell-cell interaction network in health and periodontitis. Colors and widths of edges represent number of interaction pairs between cell types. (D) Immunofluorescent (IF) staining of T/B cell and macrophages. Red shows the signal of CD11b staining (macrophage marker); green shows the signal of CD3 (T-cell marker) at left and the signal of CD19 (B-cell marker) at right; and blue shows DAPI staining. (E) The number of CD3+ cells around each CD11b+ cell at left and the number of CD19+ cells around each CD11b+ cell at right (healthy donors, n = 5–7; patients, n = 5–7). The number of T/B cells within a limited distance of a macrophage cell is counted then the mean was calculated. One dot per individual. Small horizontal lines indicate the mean (± s.d.). **p ≤ 0.01, ****P < 0.0001 as determined by Student’s t-test. (F) Dot plot of the interaction between cytokine/chemokine and their receptors in selected subcell types of periodontitis. Size of spot indicates significance (−log10(p-value)). Color indicates expression levels (log2 mean (molecule 1–molecule 2).

