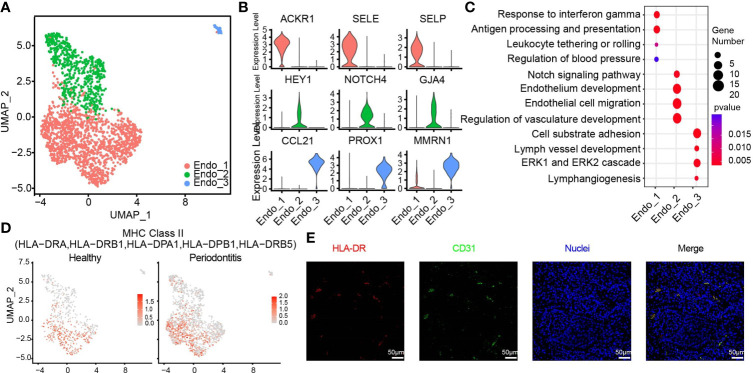
Figure 4.
HLA-DR expressing endothelial subcluster in human gingiva. (A) UMAP visualization of endothelial subclusters in the combined health (n = 2; 596 cells) and periodontitis (n = 2; 1,363 cells) dataset. (B) Violin plots showing expression levels of cluster-defining genes for endothelial subsets. Expression values are normalized and scaled averages. (C) Dot plots showing the enriched gene ontology biological process terms for each endothelial cluster. (D) The expression of HLA-DR was projected on the UMAP plot. Red indicates maximum gene expression, while grey indicates low or no expression. The gene expression levels are normalized and transformed as ln (CPM/10). (E) Immunofluorescence assay for the MHC class II marker HLA-DR (red) and the endothelial cell marker PECAM1 (CD31, green) and with DAPI (blue) in the subepithelial region. Scale bar: 50 μm.

