Figure 5.
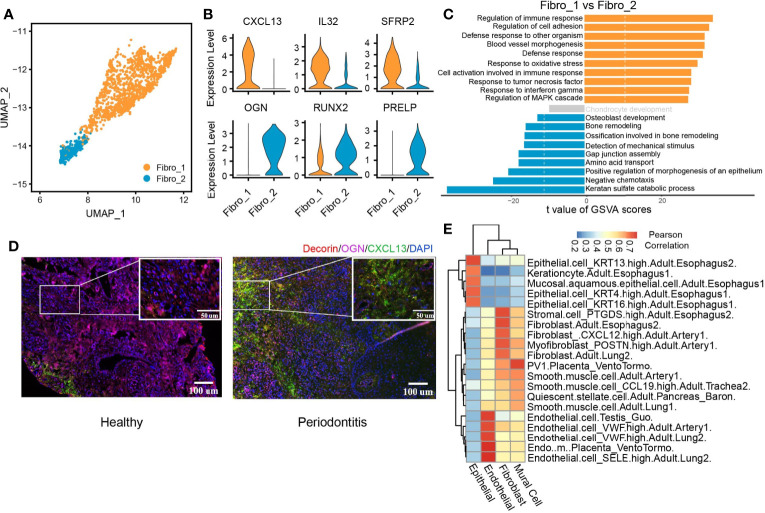
CXCL13+ fibroblast subcluster associated with immune response. (A) UMAP visualization of two fibroblast subclusters in the combined health (n = 2; 244 cells) and periodontitis (n = 2; 1,260 cells) dataset. (B) Violin plots showing the expression distribution of selected genes associated with functions in the fibroblast clusters. The gene expression levels are normalized and transformed as ln (CPM/10). (C) Differences in pathway activities scored per cell by GSVA between fibro_1 and fibro_2. Shown are t values from a linear model, corrected for fibro_1. (D) Immunofluorescent (IF) staining validation of fibroblast subtypes. Red shows the signal of decorin staining (fibroblast marker); green shows the signal of CXCL13 staining; purple shows the signal of osteoglycin (OGN), and blue shows DAPI staining. Scale bar: 100 μm for main images and 50 μm for detail images. (E) Application of scHCL analysis for nonimmune cells. Each row represents one cell type in scHCL. Each column represents a cell cluster in our dataset. Pearson’s correlation coefficient was used to evaluate cell-type gene expression similarity. Red indicates a high correlation; blue indicates a low correlation.

